Revenue Cycle Analytics: Seeing Problems Before They Hit Your A/R

TL;DR: A/R growth is the last symptom of a revenue problem, not the first. Revenue Cycle Analytics Software works when it flags a denial pattern days before submission, not weeks after payment posting. This guide walks through what actually separates reporting tools from software that changes an outcome.
A denial pattern often starts three weeks before anyone notices it in A/R. A billing team at a mid size orthopedic group once watched their days in A/R climb for six weeks before anyone traced it back to a single payer changing its prior authorization rules for one procedure code. By the time the number showed up on a finance report, forty claims were already stuck.
This is the real argument for Revenue Cycle Analytics Software: A/R is a lagging signal, and the financial opportunity sits earlier, in the operational data that produces it. Predictive denial analytics healthcare programs connect those early signals to the people who can act on them before a claim ever leaves the building.
This guide moves through measuring, detecting, predicting, acting, and quantifying the financial impact of getting ahead of denials.
The Revenue Cycle View That Matters
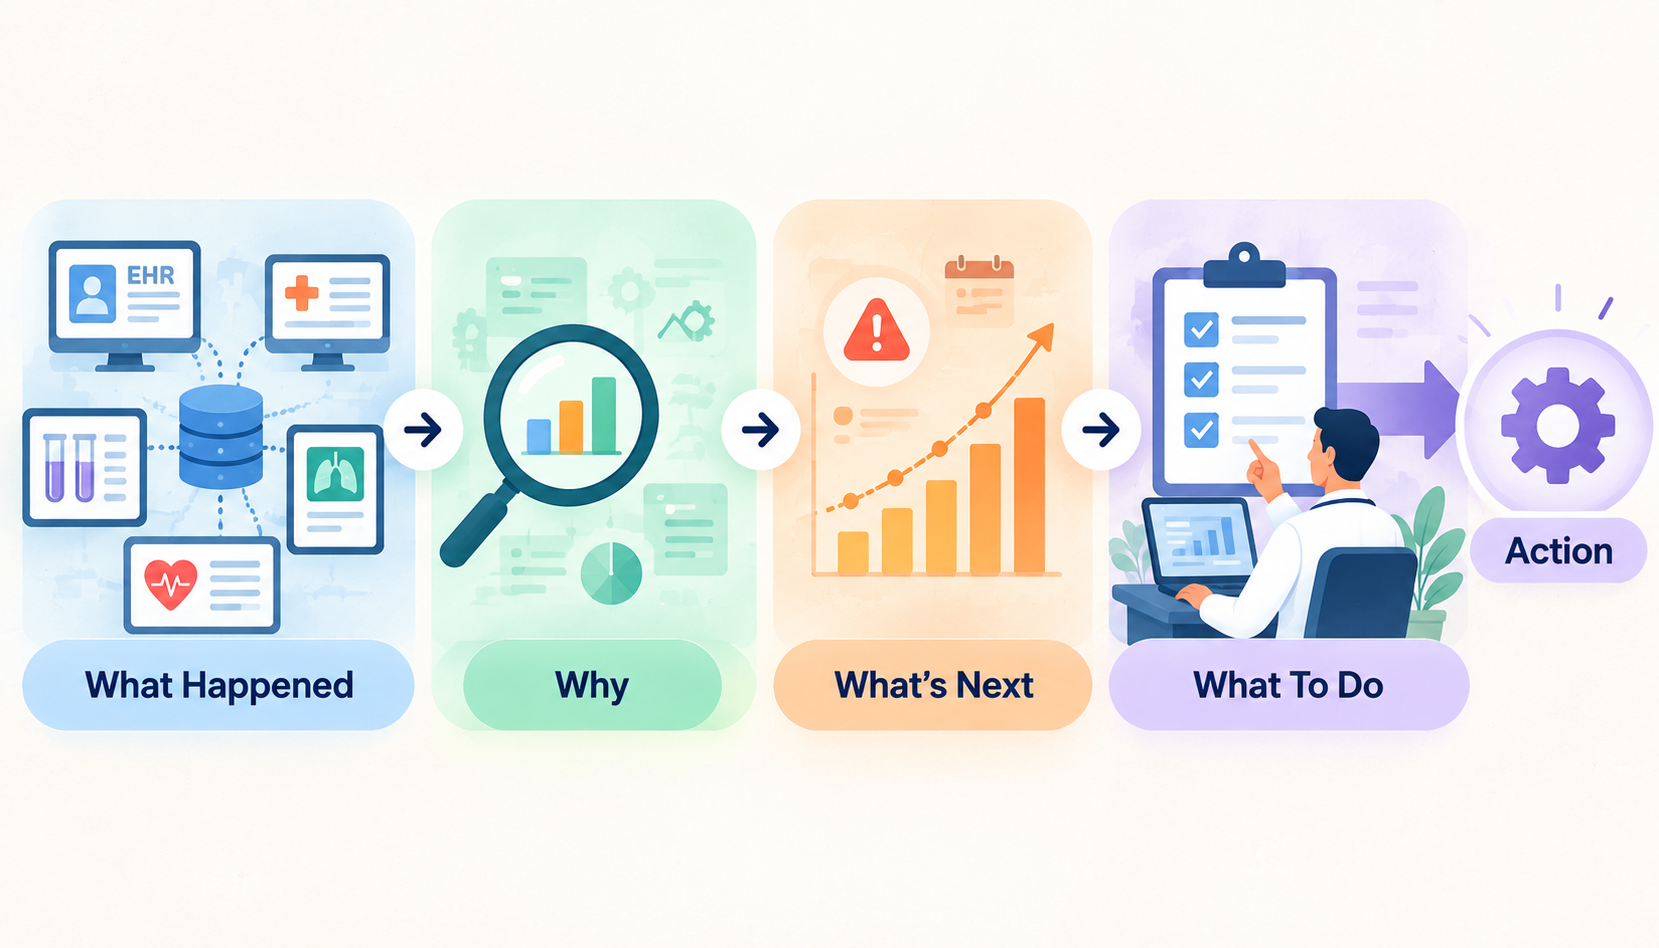
Descriptive analytics answers what happened, and it forms the entry level layer of nearly every Revenue Cycle Analytics Software package on the market. It tells a billing director that denials rose eight percent last month or that one payer paid eleven days slower than usual.
Diagnostic analytics answers why it happened. It connects that rise to a root cause, such as a coding update that never reached the billing team or a change in payer edits, and this is where basic Revenue Cycle Analytics Software already earns its cost.
Predictive analytics answers what is likely to happen next. Good Revenue Cycle Analytics Software scores claims for denial risk before submission using patterns from thousands of prior claims.
Prescriptive analytics answers what the team should do about it. It assigns the claim to the right person with a specific action, and this final layer is what turns Revenue Cycle Analytics Software into a working system, not simply a report library.
The progression matters because a team cannot fix yesterday's denial. It can only act on a signal that points to tomorrow's risk, and understanding the broader healthcare revenue cycle management process helps teams act before financial problems become harder to recover.
The KPIs Everyone Tracks and Where They Stop Being Useful
Four numbers anchor most revenue cycle dashboards, and every finance leader using Revenue Cycle Analytics Software should know what each one means without a translator.
|
Metric |
What it tells you |
Why it matters |
|
Denial rate |
Share of claims rejected by payers. |
Direct measure of billing accuracy and payer friction. |
|
Days in A/R |
Average time to collect after service. |
Speed of cash conversion. |
|
Clean claim rate |
Share of claims accepted on first submission. |
Quality of front-end and coding processes. |
|
Net collection rate |
Actual collections against allowed amount. |
True financial performance after write-offs. |
These four numbers form the baseline for any serious KPI tracking healthcare finance program, and any Revenue Cycle Analytics Software worth buying needs to report them without extra configuration on day one.
A platform that struggles with these four basics rarely delivers on more advanced predictive denial analytics healthcare claims later in the sales pitch, especially when it cannot connect analytics with the underlying medical billing software workflow.
Why a Dashboard Full of Lagging Metrics Doesn't Prevent the Next Denial
Denial rate confirms a problem already happened. Days in A/R confirms money is already delayed. Net collection rate confirms the financial outcome after the damage is done.
Clean claim rate comes closest to an early warning, yet it still reports on claims already submitted. None of these four metrics identify which emerging pattern will fail next week.
Denial data built only around historical percentages leaves a finance team reacting to a trend line. It rarely points to a specific, addressable claim segment. A dashboard can show exactly where revenue got hurt without ever pointing to where the next injury is forming.
That gap is where predictive denial analytics healthcare organizations increasingly turn to a deeper layer of Revenue Cycle Analytics Software.
How Predictive Denial Analytics Spots Problems Before They Happen
A useful model inside Revenue Cycle Analytics Software built for predictive denial analytics healthcare teams depends on several inputs working together, and no single clever algorithm carries the load alone.
Payer history: how a specific payer has treated similar claims over time.
Coding patterns: modifiers, code combinations, and documentation gaps that correlate with rejection.
Eligibility gaps: coverage checks that failed or were skipped before the visit.
Prior authorization status: whether approval was obtained, pending, or missing entirely.
Claim type and procedure and payer combination: certain pairings carry far higher risk than others.
Provider and location patterns: some sites and providers see denial clusters others never experience.
Historical denial patterns and outcomes from previously adjudicated claims for the same payer and service line.
Prediction quality depends entirely on the depth and breadth of historical data feeding the model. A platform trained on twelve months of claims across every payer will outperform one trained on three months from a single service line, every time, while effective denial management in healthcare turns those historical patterns into prevention and workflow improvements. This is the truth vendors rarely say out loud when pitching Revenue Cycle Analytics Software.
Leading Indicators vs Lagging Metrics: What Should Be Watched Daily
Lagging metrics confirm what already happened. Leading indicators point to what is forming right now, and a team that watches only the first set is always one step behind.
|
Lagging metric |
Leading indicator |
|
Denial rate |
Emerging payer-specific denial pattern. |
|
Days in A/R |
Growing unresolved claim queue. |
|
Write offs |
Increasing volume of high-risk claims. |
|
Net collections |
Payment variance against expected reimbursement. |
|
A/R aging |
Submission or authorization anomalies. |
The goal is not to replace monthly KPI reviews. It is to give a team a second, faster signal through predictive analytics in healthcare that explains where those KPIs are heading, days before the monthly report confirms it.
Closing the Loop: From Predictive Flag to Billing Team Action
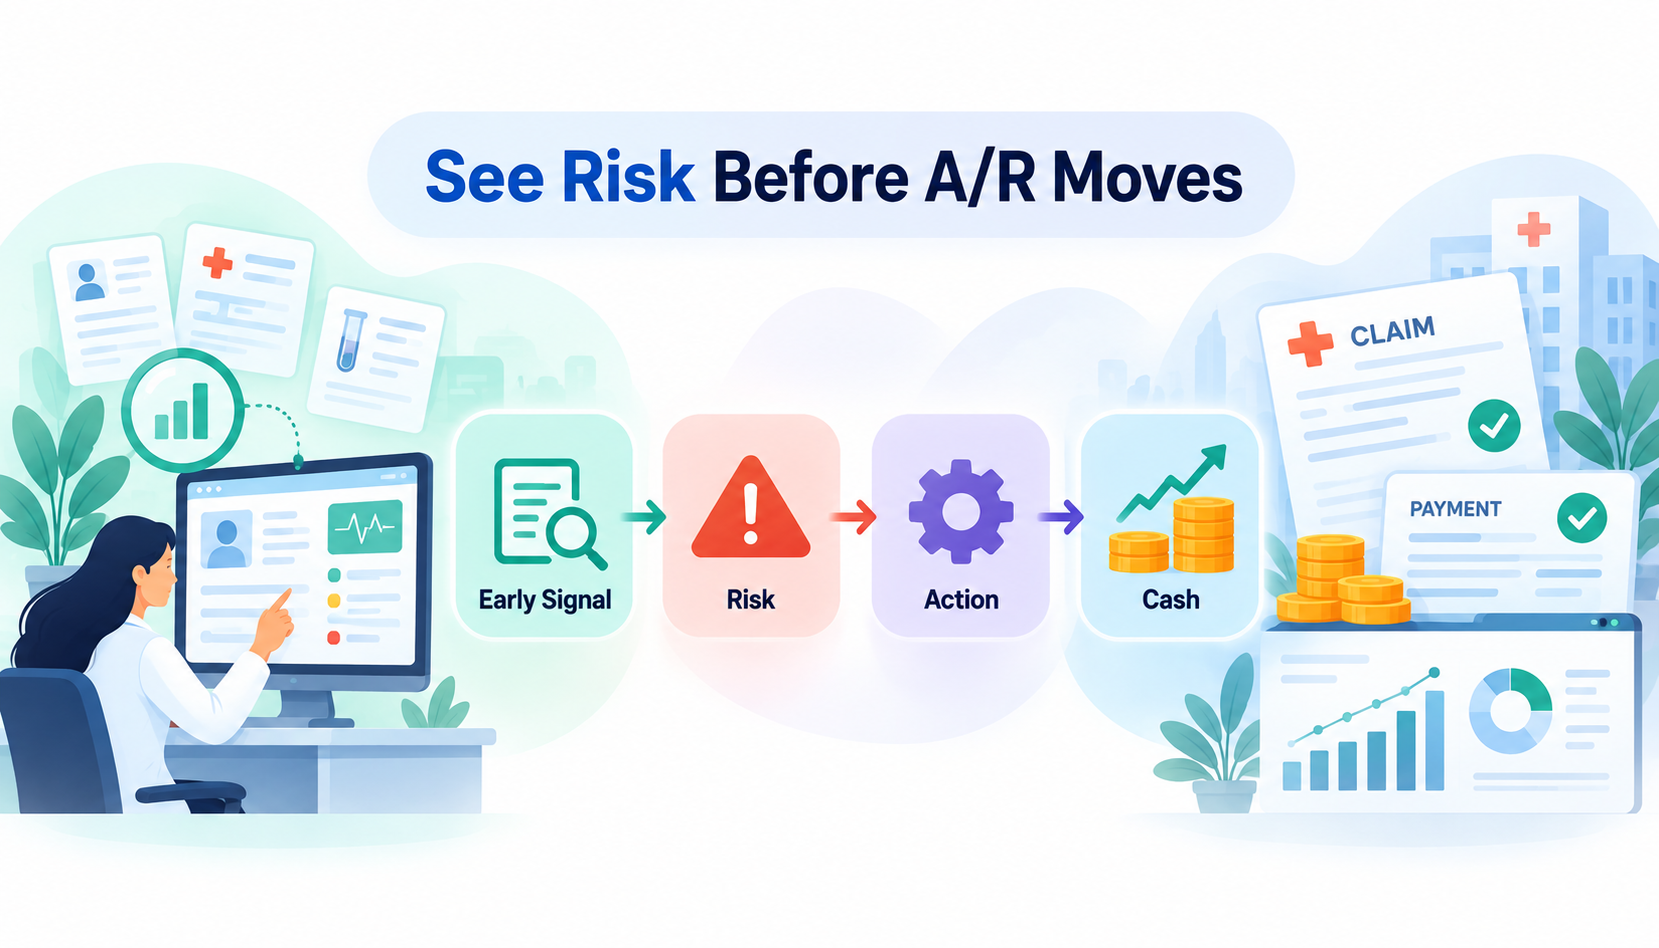
A prediction without an assigned owner is just another alert nobody opens. Real value from Revenue Cycle Analytics Software comes from a five-step chain: risk detected, claim or segment identified, owner assigned, intervention taken, outcome measured.
An authorization risk routes straight to the authorization team before submission. A coding risk routes to coding for a second review. An eligibility issue routes to the front office before the visit even happens.
A payer specific pattern escalates to billing leadership, so contract or workflow changes can follow, and this routing logic is what separates mature Revenue Cycle Analytics Software from a basic alert feed.
This workflow connection is the single biggest gap in most predictive denial analytics healthcare tools on the market today. Plenty of platforms can generate a risk score.
Very few connect that score to a person, a task, and a deadline, and that missing link is exactly where healthcare workflow automation can turn a smart model into an operational process.
Why Most RCM Analytics Rollouts Underdeliver
Inconsistent definitions weaken every report. Different systems can record the same claim event differently.
“Submitted” can mean different things. An EHR may mark submission immediately, while a clearinghouse confirms acceptance hours later.
Payer statuses can add another gap. Portal updates may not yet match the EHR or clearinghouse, which makes standardized healthcare claims exchanges increasingly important; CMS has established HIPAA-adopted healthcare claims standards for claims attachment transactions and electronic signatures.
Small gaps compound at scale. Across a health system, they can distort the claim-to-cash view, making a well-designed healthcare data warehouse valuable for creating a consistent analytical foundation.
Analytics needs reliable data underneath. Even strong Revenue Cycle Analytics Software cannot fix inconsistent definitions without proper healthcare data integration across EHRs, clearinghouses, payer systems, and financial platforms.
Alert Fatigue: When Predictive Just Creates More Noise
Too many alerts create alert fatigue. A platform generating hundreds of alerts a day can quickly train teams to ignore them.
Actionability matters more than alert volume. Buyers should ask how many alerts it generates, how many require action, and whether it ranks them by financial impact.
Urgency should be obvious at a glance. Billing teams should be able to distinguish a high-risk claim from a low-value flag immediately.
Good Revenue Cycle Analytics Software prioritizes action over volume. Any vendor emphasizing alert counts over precision should face deeper questions about its predictive denial analytics healthcare capabilities.
The Missing Owner: Who Is Accountable for Acting on the Insight
A prediction without an owner changes nothing. Every flagged risk needs someone responsible for acting on it.
Accountability needs to be visible. Each alert should have an owner, a deadline, and a way to track resolution.
Action must be measurable. Teams should be able to see whether the intervention actually resolved the risk.
Ownership often determines whether analytics delivers value. This gap is a major reason Revenue Cycle Analytics Software rollouts lose momentum after a successful pilot.
Evaluate Revenue Cycle Analytics Software by Its Decisions
Can the Platform Trace a Financial Problem Back to Its Operational Cause
Give any vendor selling Revenue Cycle Analytics Software this exact test during a demo: our A/R increased this month, show me why.
A platform worth buying should trace that answer from A/R to payer, from payer to service line, from service line to claim, and from claim to root cause and owner, supported by API-first healthcare integration where multiple systems need to exchange data reliably.
This chain matters far more than how many charts a tool can render, and it is the fastest way to separate real Revenue Cycle Analytics Software from a pretty reporting layer.
What to Evaluate Before Choosing RCM Analytics Software
|
Evaluation criteria |
What to assess |
Why it matters |
|
Data source coverage |
What does the platform ingest today? |
Prevents gaps in your claim-to-cash view. |
|
Data refresh |
Real-time or batch? How often does it refresh? |
Determines how quickly teams can respond. |
|
Claim-level drill-down |
Can users reach claim detail in two clicks or fewer? |
Makes investigation faster and practical. |
|
KPI standardization |
Are metrics consistent across departments and locations? |
Prevents conflicting financial reports. |
|
Predictive denial analytics healthcare |
Can it flag denial risk before submission? |
Creates time to prevent the denial. |
|
Model transparency |
Can users see factors behind each risk score? |
Helps teams trust and validate predictions. |
|
Alert prioritization |
Are alerts ranked by financial impact? |
Keeps teams focused on high-value risks. |
|
Workflow integration |
Do insights trigger operational action? |
Prevents analytics from becoming another reporting layer. |
|
Time to value |
How quickly is historical data usable after go-live? |
Shows how soon the investment can deliver value. |
|
Model performance |
How is accuracy measured over time? |
Ensures Revenue Cycle Analytics Software keeps delivering reliable predictions. |
Not every product marketed as Revenue Cycle Analytics Software actually predicts anything. A reporting tool says your denial rate increased last month.
A genuine predictive platform says this specific payer and procedure combination shows a rising probability of denial, representing a defined dollar exposure, and the authorization workflow should intervene before the next batch goes out.
That contrast is the exact test every buyer should apply before signing a contract for Revenue Cycle Analytics Software.
The Business Case Leadership Needs to See
Frame ROI Around Cash, Leakage, and Cost to Collect
Revenue cycle leaders do not care how many dashboards a Revenue Cycle Analytics Software package ships with. They care about dollars recovered, days removed from A/R, and the true cost of collecting each dollar of revenue. This is where predictive denial analytics healthcare investments prove their value in measurable financial outcomes.
The business case for Revenue Cycle Analytics Software should quantify denials prevented in dollars, revenue recovered, A/R days reduced, underpayments identified, rework hours eliminated, and cost to collect reduced across the full cycle, including downstream improvements in medical invoice software and patient payment workflows.
Leaders who prioritize financial impact over report counts are far more likely to invest in technology that delivers measurable revenue improvement.
Measure the Cost of Delayed Visibility
The financial damage is rarely the denial itself. It is the gap between when the signal first appears and when someone finally acts on it.
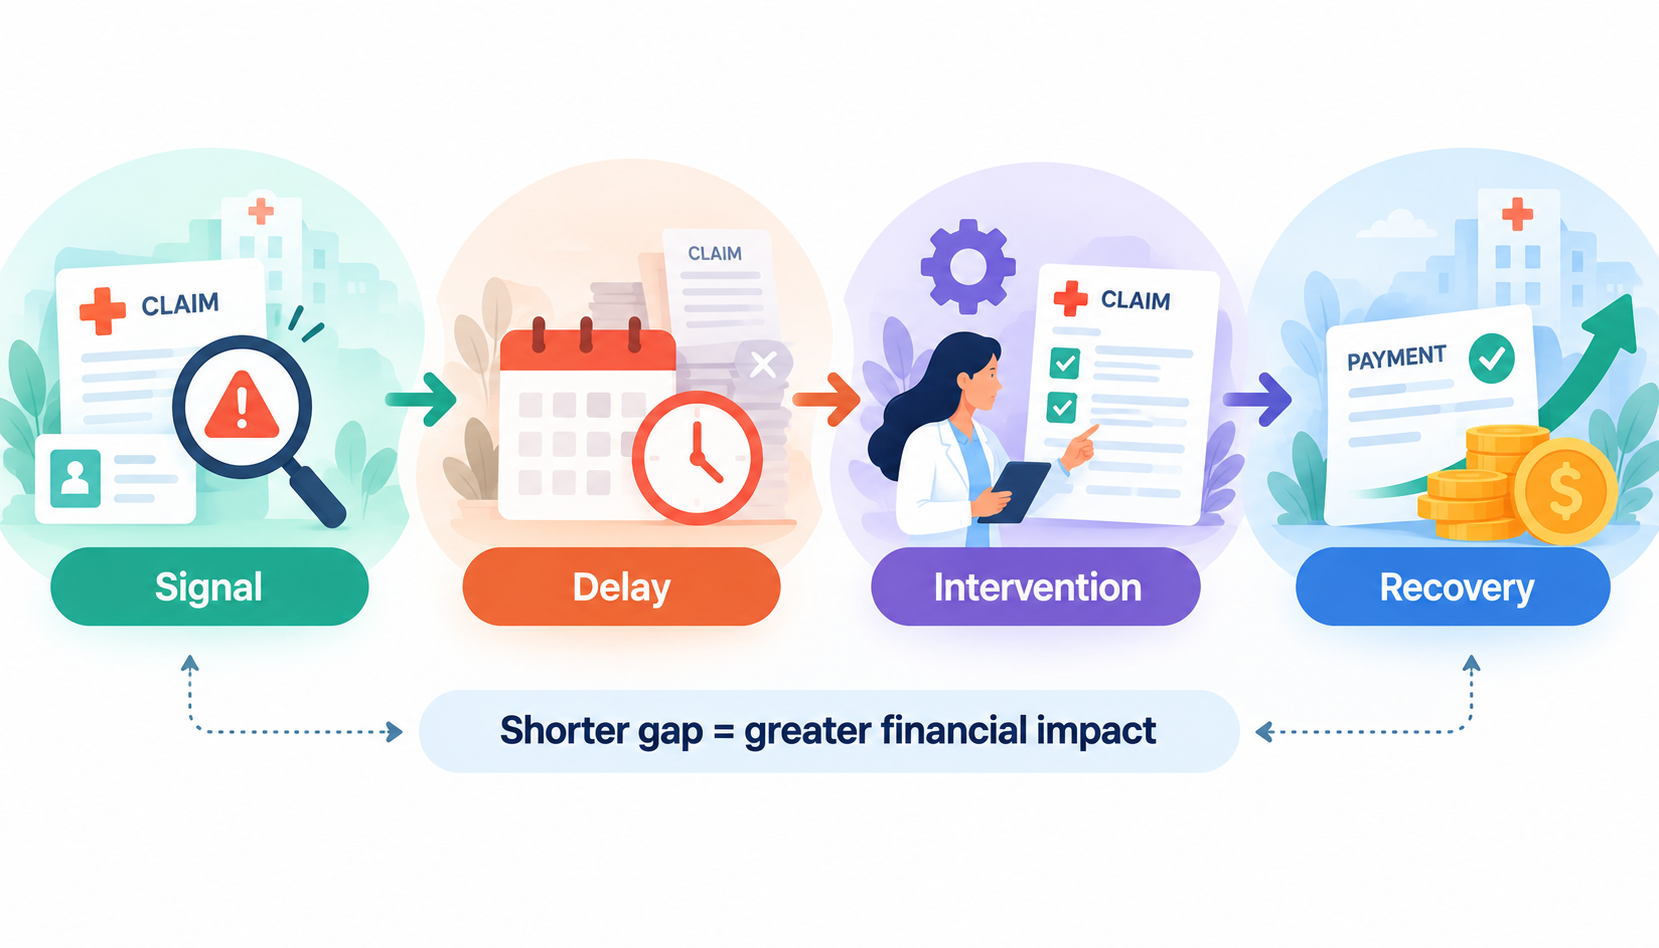
That gap runs through a predictable sequence: signal appears, reporting delay follows, investigation begins, intervention happens, recovery finally starts. The longer that sequence runs, the more revenue ages into a hard to collect category or disappears entirely.
Strong Revenue Cycle Analytics Software exists to shrink the distance between signal and intervention, and that compression is where most of the real financial value hides.
What Should Change in 90 Days vs 12 Months
The first ninety days of any predictive denial analytics healthcare rollout should consolidate data sources, standardize KPI definitions across departments, identify the highest impact denial patterns, and establish visibility by payer and service line. Early predictive signals get validated against real outcomes during this window too.
By twelve months, preventable denial patterns should be visibly declining, and the A/R trajectory should be improving month over month.
Payer performance becomes something a team can measure and negotiate with confidence, predictive denial analytics healthcare models sharpen from real outcome data, and analytics becomes part of daily operational decisions. This is the honest timeline for Revenue Cycle Analytics Software, and any vendor promising results in week one is overselling the pilot.
The Revenue Cycle Analytics Test: Can You Act Before A/R Moves
What is changing? Identify emerging shifts before they become financial problems.
Why is it changing? Trace the signal back to its operational cause.
What is likely to happen next? Detect risks early enough to prevent avoidable denials or revenue leakage.
Who needs to act? Connect each insight to the right team or owner.
What is the financial impact? Quantify the revenue at risk, not just the number of affected claims.
The real measure is earlier action. Good Revenue Cycle Analytics Software helps teams see problems sooner, identify the cause with confidence, and act before claims age into difficult-to-recover or permanent write-offs.
How Patoliya Infotech Approaches Revenue Cycle Analytics
Patoliya Infotech approaches Revenue Cycle Analytics Software as an operational layer, not simply a reporting interface, using custom software development services to connect claims, payer responses, payments, denials, and A/R data around existing workflows.
The focus starts with connecting claims, payer responses, payments, denials, and A/R data into a consistent view.
From there, teams can establish trusted KPIs, identify recurring denial patterns, prioritize financially significant risks, and connect insights to the people responsible for resolving them.
Predictive denial analytics healthcare capabilities are most useful when they fit existing billing workflows rather than create another queue to manage.
The practical objective is simple to help RCM and finance teams move from identifying revenue problems after they occur to acting while there is still time to change the outcome.
Conclusion
Revenue cycle analytics becomes valuable when it changes the timing of a decision. Revenue Cycle Analytics Software should help teams move beyond reporting denial rates and Days in A/R toward understanding what is changing, why it is changing, and where financial risk is building.
That requires connected data, trusted KPI definitions, meaningful predictions, clear ownership, and workflows that turn insight into action. For healthcare organizations, the goal is not another dashboard. It is earlier visibility, faster intervention, and measurable improvement in cash, denials, A/R, and revenue leakage before problems become harder to recover.
FAQs:
Reporting tells a team what already happened to denials and collections. Revenue Cycle Analytics Software with predictive capability scores claims for risk before submission, giving teams time to fix an issue before a payer ever measures its damage.
It scores each claim against payer history, coding patterns, and authorization status before submission, flagging high-risk claims to the right team member so the issue gets fixed before the payer ever sees the claim.
Denial rate, days in A/R, clean claim rate, and net collection rate form the baseline scorecard for any Revenue Cycle Analytics Software, but the platform should also surface leading indicators like emerging payer patterns days before those four numbers move.
Ninety days typically brings consolidated data and standardized KPIs. Meaningful denial reduction and measurable A/R improvement usually appear by months six to twelve as predictive models refine against real outcomes.
Smaller practices often see faster results from Revenue Cycle Analytics Software because their claim volume and payer mix are simpler to model accurately, making root cause identification and workflow fixes quicker to implement and measure.
Ask what data sources the Revenue Cycle Analytics Software ingests, how often data refreshes, whether users can drill to claim level detail, and whether predictive risk scores connect directly to an assigned workflow owner and deadline.