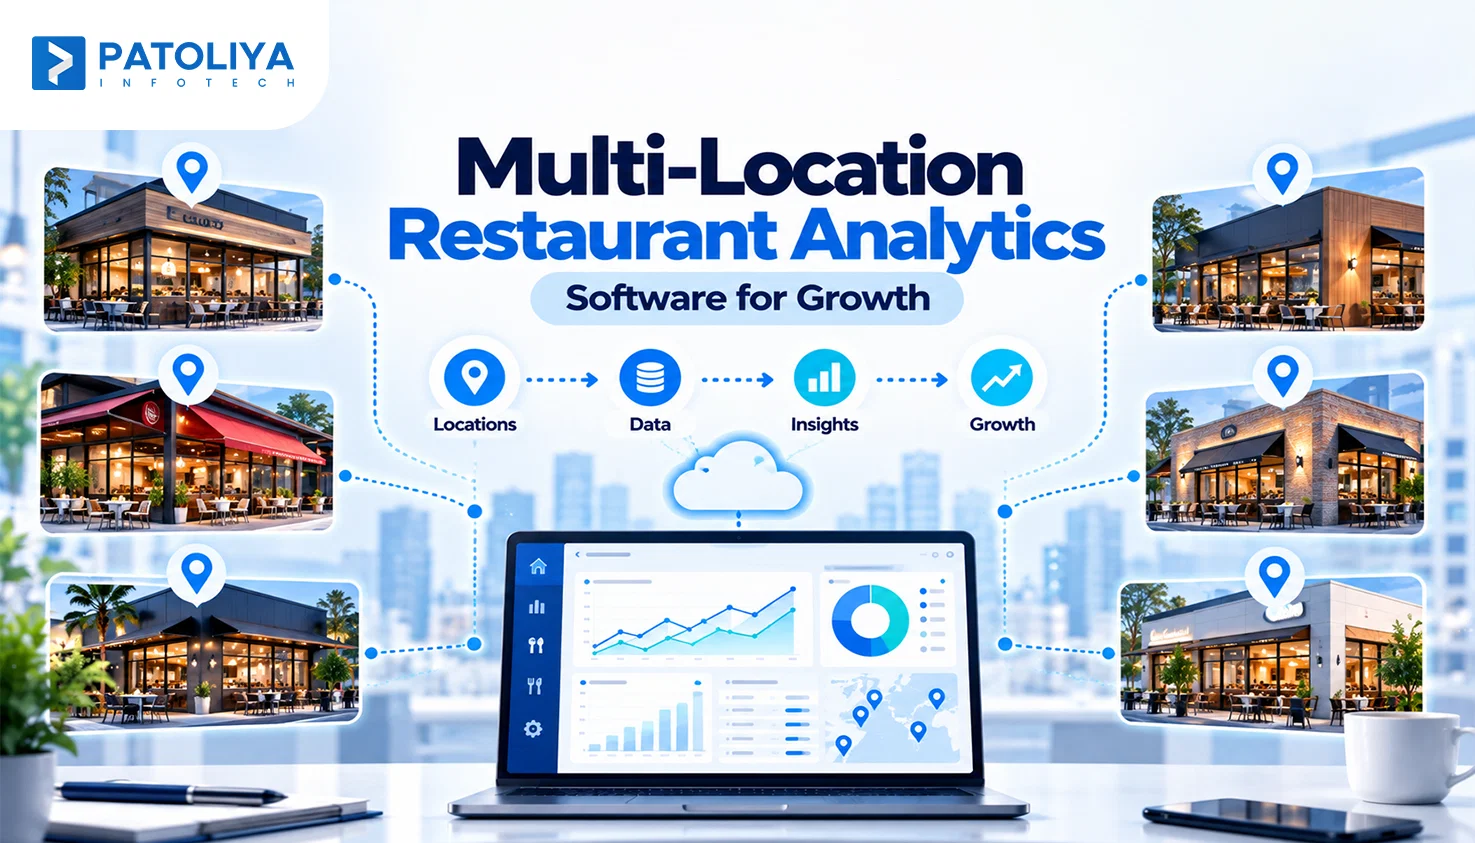
Multi-Location Restaurant Analytics: How Chains Actually Consolidate Their Data
TL;DR: Chains do not fail because they lack data. They fail because five systems report five different versions of the same number. Multi-location restaurant analytics software only creates value when the underlying data gets standardized before it reaches a dashboard.
A chain with forty locations does not have a reporting problem. It has forty different definitions of what counts as a sale. Most operators assume a dashboard fixes this. It does not. A dashboard displays whatever the underlying pipeline feeds it, and if that pipeline pulls inconsistent numbers from ten different systems, the dashboard simply makes bad numbers look organized.
This is the real reason multi-location restaurant analytics software projects stall after the demo phase. The software works fine. The data feeding it was never made comparable across locations. A true restaurant chain data warehouse exists to solve exactly this problem, and this guide breaks down what actually breaks during consolidation, what leadership should test before signing a contract, and when the investment pays for itself.
What Consolidated Data Actually Covers
A multi-location restaurant analytics software platform brings POS, labor, inventory, delivery, and loyalty data into one comparable structure so every location reports numbers that mean the same thing through better data interoperability across its broader restaurant technology ecosystem.
The five sources every chain needs to combine:
|
Source |
What it tracks |
|
POS and transactions |
Sales, discounts, voids, refunds |
|
Inventory and purchasing |
Food cost, supplier pricing, waste |
|
Labor and scheduling |
Hours, overtime, labor percentage |
|
Delivery and aggregators |
Commission, order mix, channel margin |
|
Loyalty and CRM |
Repeat visits, spend per guest |
Accounting sits above these five as the reconciliation layer that turns operational activity into financial truth, especially when restaurant management software and other operational systems feed the same reporting environment. A chain can own complete data across every one of these five sources and still be unable to answer a basic question the same way twice. That is not a data volume issue.
It is a comparability issue, and comparability is what a restaurant chain data warehouse is actually built to fix. Collecting data is easy. Making it comparable across forty kitchens, three POS vendors, and two acquisitions is the real work.
The Standard Multi-Location Analytics Stack Compressed
Centralized reporting gives leadership a unified view of performance across locations, but multi-location restaurant analytics software earns trust only when its cloud infrastructure services support reliable data refresh, monitoring, and reconciliation.
Centralized reporting and benchmarking, in short:
- Corporate, region, and location level views.
- Same store comparisons over trailing periods.
- Executive summaries with drill down to unit level.
- Peer comparison across similar formats.
Real-time reporting rarely means what buyers assume:
|
Data type |
Typical refresh |
|
Transaction feeds |
Minutes |
|
Operational metrics |
Hourly or daily |
|
Financial reconciliation |
End of day or next day |
A centralized multi-location restaurant analytics software platform advertising real-time visibility usually means the transaction feed refreshes fast, not that the financial number on the executive report has been reconciled yet.
Leadership that treats a same day preliminary number as a closed financial number ends up correcting decisions later. This gap between operational speed and financial accuracy is where the next section matters most.
What Actually Breaks When Chains Try to Consolidate Data
Consolidation breaks at the exact points most vendors skip during a demo: mismatched POS systems from acquisitions, metric definitions that vary by location, and data governance built for a single owner rather than a multi-unit organization.
Acquisitions create technology stacks nobody designed on purpose. A chain that grows through acquisition inherits whatever POS and other types of restaurant technology the acquired location already ran.
Legacy terminals, franchise-specific software, and inconsistent export formats all show up in the same multi-location restaurant analytics software rollout. The location everyone avoids testing is usually the location that determines whether the whole project succeeds.
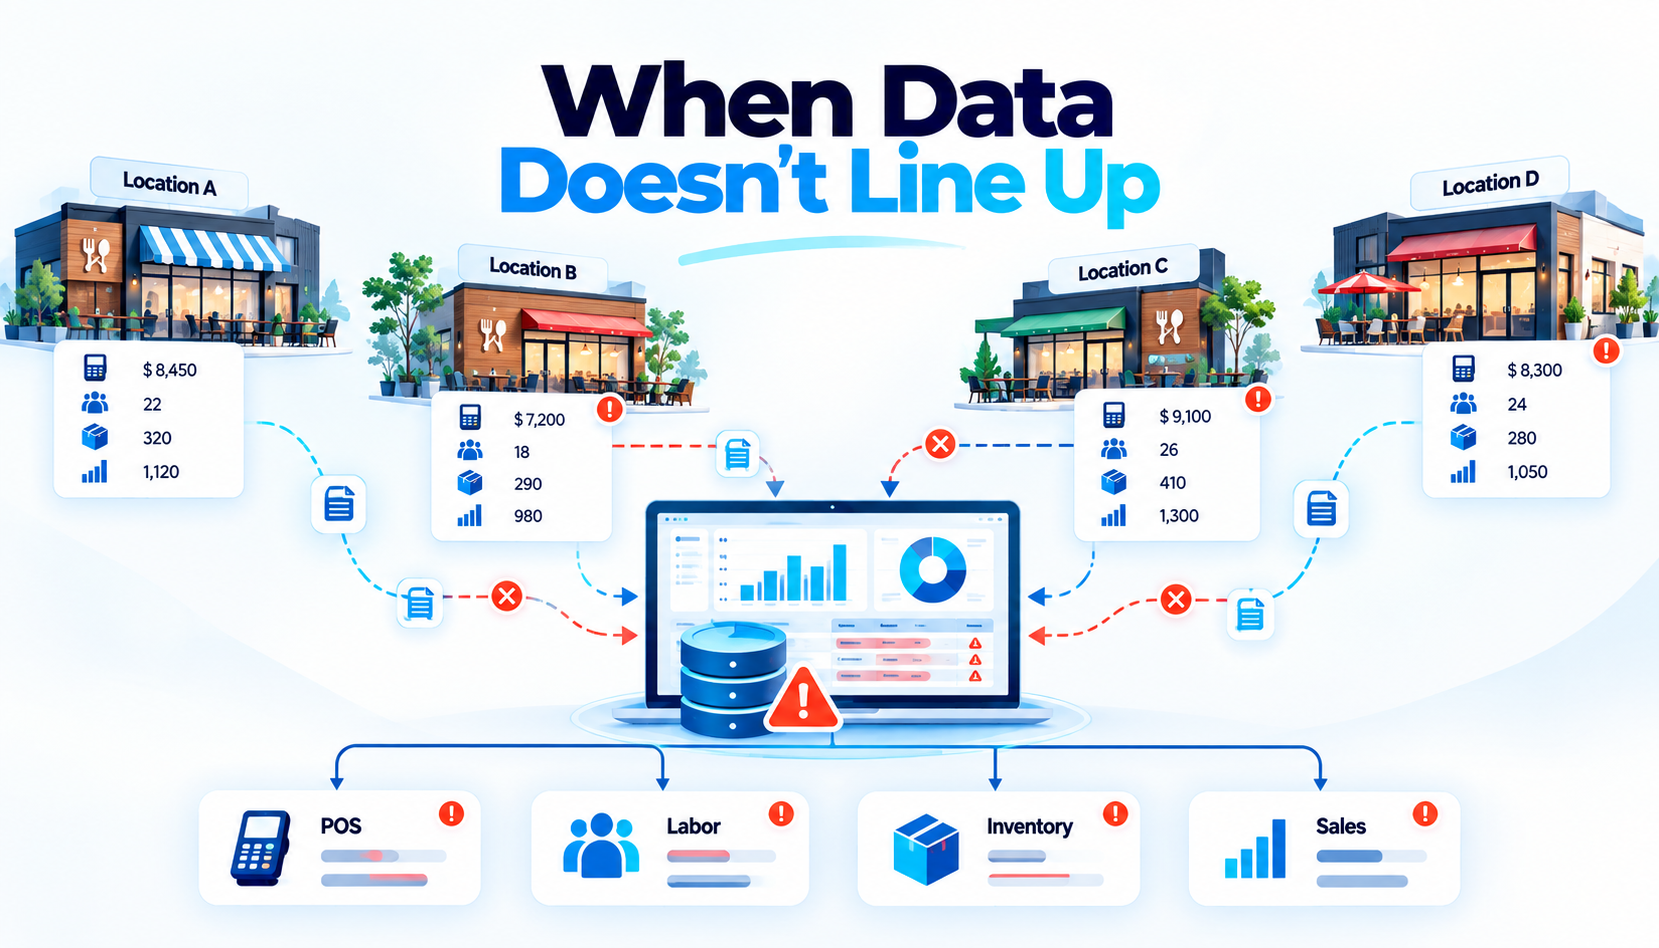
Metric definitions drift long before anyone notices. Same store sales, net sales, discounts, voids, labor cost, and food cost get calculated differently at different locations far more often than executives expect.
A centralized dashboard cannot repair a definition problem. Only a governed restaurant chain data warehouse with one agreed formula per metric can.
Latency breaks the idea of a single source of truth. Data moves through ingestion, transformation, API integration, and reconciliation before it becomes a financial number.
Leadership needs to know when a figure was last refreshed, whether it is preliminary or reconciled, and which system holds final authority.
Access needs differ sharply between corporate and franchise stakeholders. Corporate visibility, regional access, franchisee-only views, and location manager permissions all require separate rules.
The real evaluation question is not whether a platform can pull the data together. It is whether the platform can do that without exposing labor or financial detail to the wrong stakeholder.
A warehouse without a semantic layer is just storage. A working restaurant chain data warehouse provides standardized dimensions, one KPI definition per metric, a clear location hierarchy, historical records, and documented lineage. Strong data governance also requires defined ownership, data quality standards, source management, and clear data lineage across the data lifecycle.
The warehouse holds the data. The semantic layer holds the agreed meaning. The dashboard only presents what both layers have already resolved.
AI chat analytics helps diagnosis. Natural language tools are strong at finding anomalies, explaining trends, and comparing locations fast.
They fail quietly when multi-location restaurant analytics software lacks governed metrics, allowing AI to mix preliminary and reconciled data. Confidence is not the same thing as correctness.
What the Analytics Should Help Leadership Decide
Identify Which Locations Need Intervention
Good analytics tells leadership which locations need intervention, which locations are fair benchmarks, and what is actually driving a margin change, not just which store ranked highest last month.
Look instead for persistent underperformance, margin deterioration over several periods, and unusual variance in labor or food cost that a single bad week would not explain.
Benchmark Comparable Locations
Compare locations with similar format, geography, volume, and daypart mix. This is where multi-location restaurant analytics software earns its place, since ranking a downtown lunch concept against a suburban dinner house tells leadership nothing useful.
Trace the Full Chain From Revenue to Margin
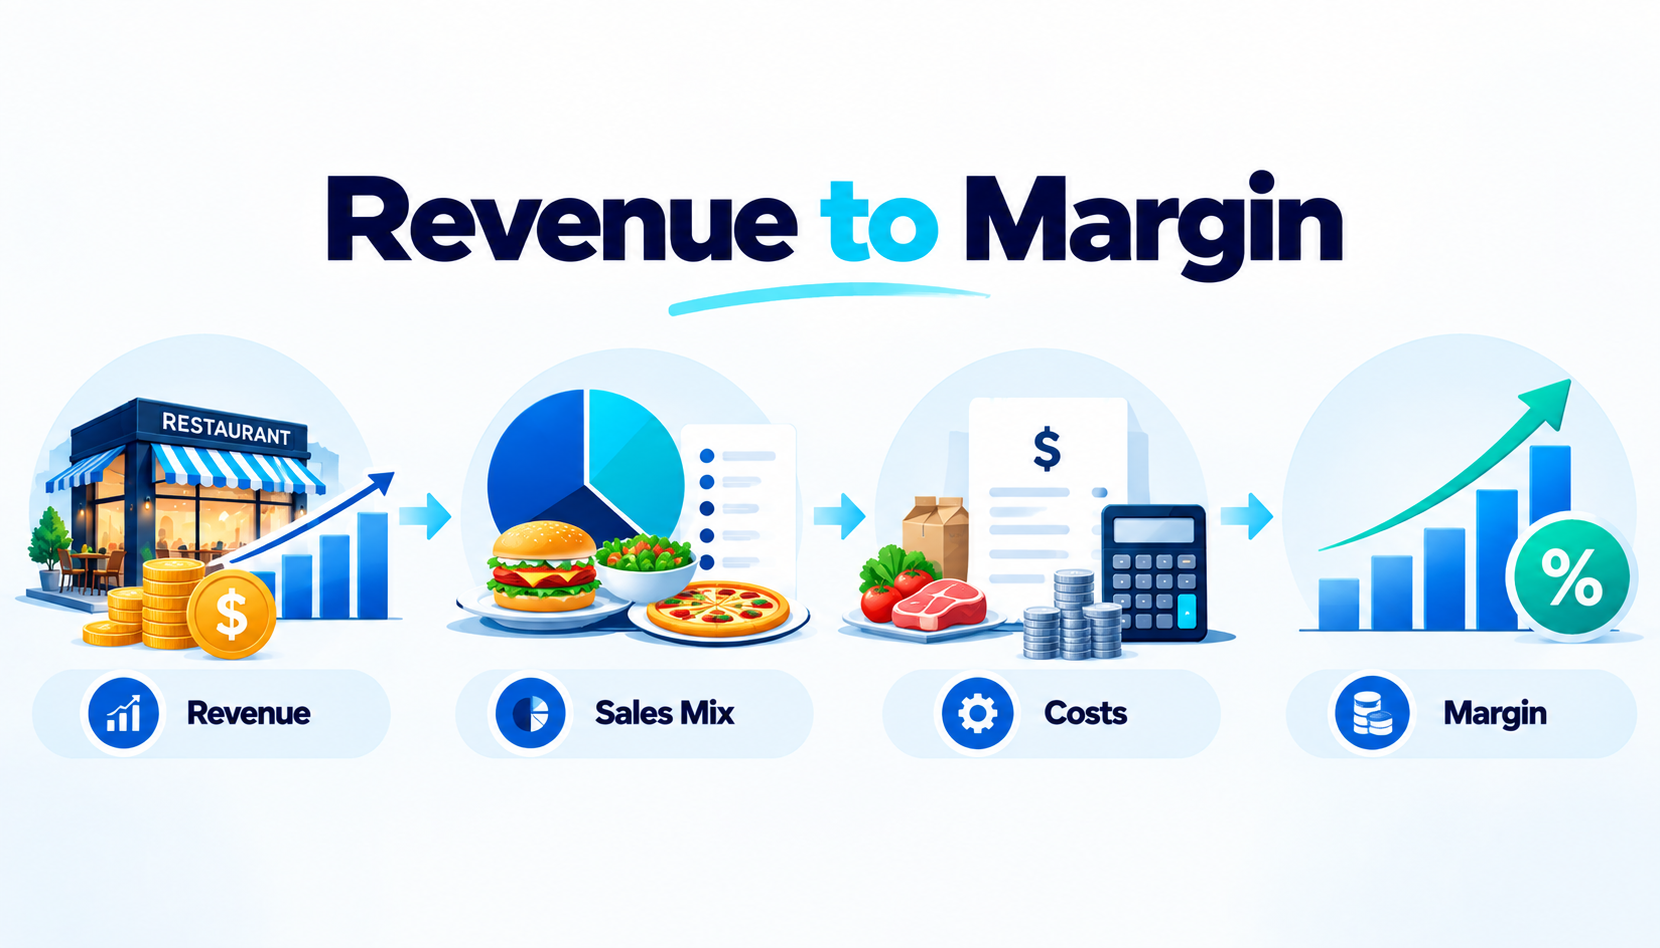
Revenue, mix, food cost, labor, and operational data from systems such as an online reservation system connect in sequence to help explain changes in margin. The goal moves from “what happened?” to “what changed, where, and what should we do next?”
Use Exception-Based Management Instead of Manual Dashboard Monitoring
Exception-based management outperforms manual dashboard monitoring. The process should be detect, diagnose, prioritize, act, and measure.
Executives cannot watch dozens of location dashboards daily, and a properly built multi-location restaurant analytics software platform should surface the exceptions on its own.
Evaluating Multi-Location Restaurant Analytics Software Before You Sign
Test any platform on the messiest location in the portfolio, force a full metric reconciliation walkthrough, and confirm data ownership terms before a contract gets signed, not after.
Use the hardest location as the proof of concept.
An acquired site, an older POS, a franchise unit, or a location with incomplete history reveals far more than the flagship store ever will. A platform that only performs well on clean data has not actually been tested.
Demand reconciliation proof.
Give the vendor a defined set of numbers and ask them to show the source value, the transformation applied, the final reported figure, and the exact refresh timestamp. The demo should prove why the number is correct.
Push on onboarding.
Ask how historical migration, new store onboarding, acquired location mapping, and menu changes actually get handled. The real scalability test is how the multi-location restaurant analytics software behaves when the chain changes, not how it looks with today's data.
Clarify ownership before signing anything.
|
Question |
Why it matters |
|
Who owns raw data |
Determines control after termination. |
|
Can history be exported |
Prevents lock-in. |
|
Additional export fees |
Hidden cost risk. |
|
Format on export |
Determines portability to another system. |
Separate marketing promises from your internal workload. A four week implementation claim means nothing without a defined scope covering data access, mapping, validation, user acceptance testing, and reconciliation.
Is Your Chain Ready for Data Consolidation
Consolidation earns its cost when fragmented reporting is already expensive, when faster visibility changes real decisions, and when leadership can name who owns the data long term, not just who sold the software.
Calculate the True Cost of Fragmentation
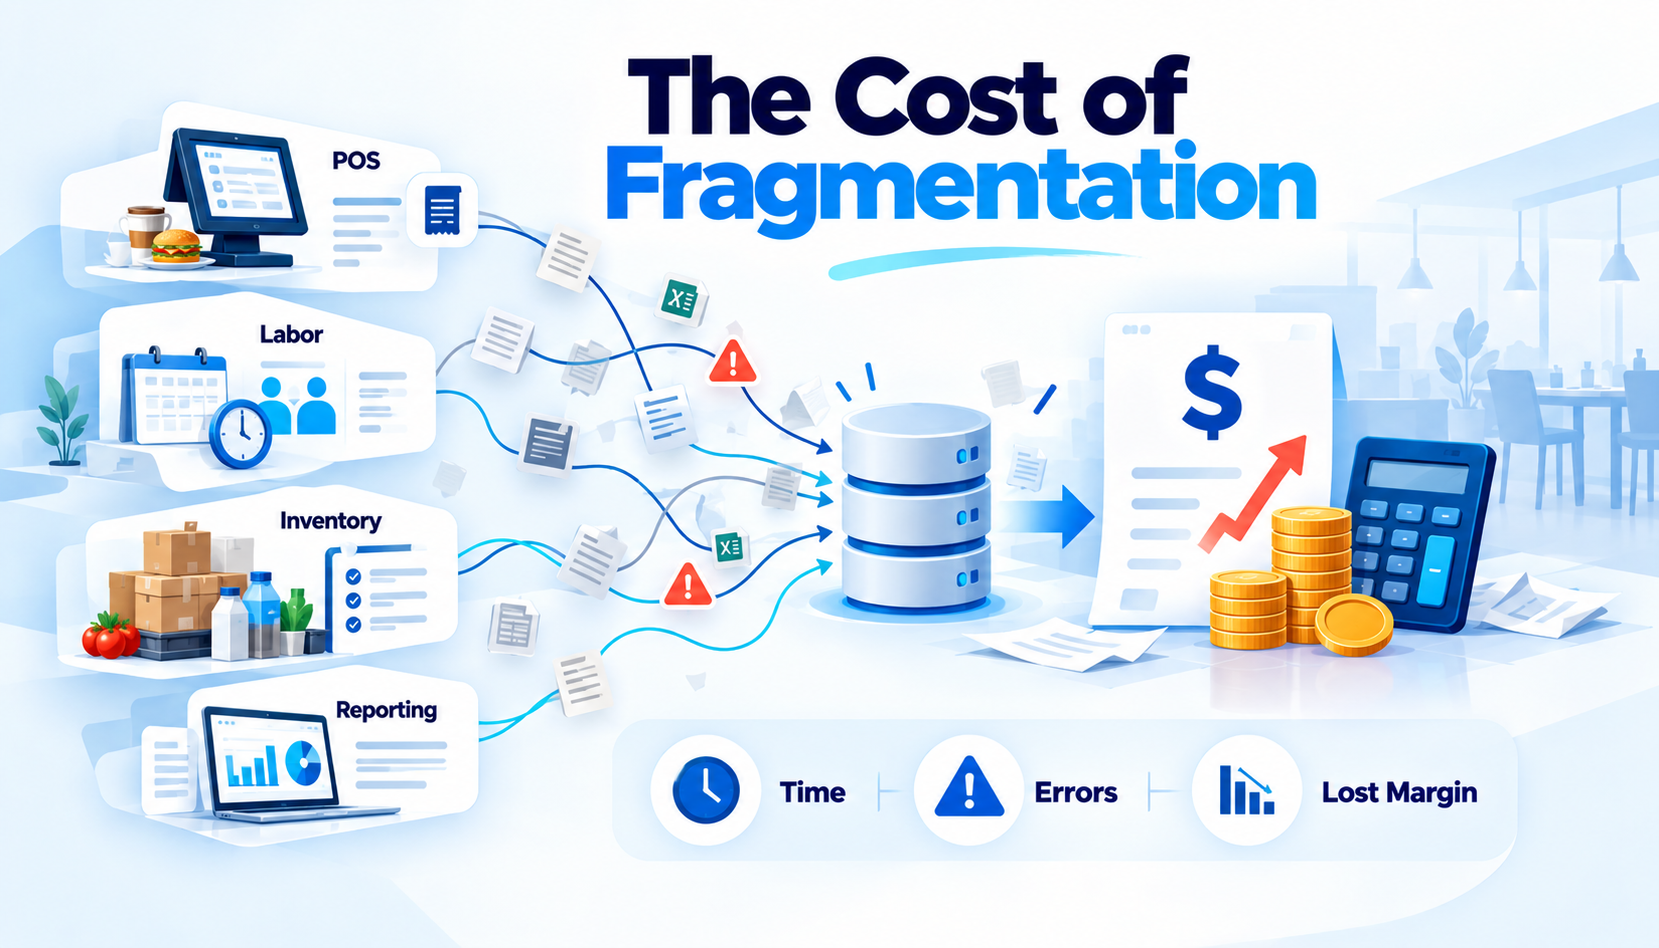
Analyst hours, manual spreadsheet work, duplicate reporting, delayed decisions, and ongoing integration maintenance all belong in the number, not just the software subscription itself.
Value Speed by the Decisions It Changes
Faster variance detection, a shorter financial close, and quicker benchmarking across locations create the real return. The strongest case for multi-location restaurant analytics software is never “better dashboards.” It is catching expensive variance sooner.
Weigh vendor dependency honestly.
|
Risk type |
What to check |
|
Vendor lock-in |
Proprietary models, closed APIs, limited exports. |
|
Internal maintenance |
Undocumented pipelines, thin institutional knowledge. |
The strategic question every executive should ask: who controls the restaurant chain data warehouse five years from now, the vendor or the chain?
Confirm Compliance Without Overbuilding It
PCI DSS handling of payment data, payment gateway integration, role-based access, franchisee data boundaries, retention policy, and encryption standards all deserve a direct answer from any vendor before signing.
Know the Signals That Mean Consolidate Now
Multiple POS systems, constant metric disputes, rapid growth through acquisition, and rising analyst headcount just to keep reports running all point to readiness.
Know When to Wait
A very small footprint, systems still in flux, no internal agreement on KPI definitions, and no clear data owner all mean the infrastructure cost will outrun the value for now.
What to Do Before Choosing a Platform
List every major data source: POS, inventory, labor, delivery, loyalty/CRM, accounting, and other connected restaurant technology systems.
Assign the current owner: Identify who owns or manages each source internally.
Document critical metrics: Note the key metrics generated from each system.
Define each metric precisely: Record the exact calculation and business definition used.
Record refresh frequency: Document whether each source updates in real time, hourly, daily, or through periodic reconciliation.
Identify reconciliation gaps: Capture known mismatches, missing data, duplicate records, and timing differences.
Document access requirements: Specify who needs access to each dataset and at what level.
Turn the inventory into a vendor test: Use the messiest location, hardest metric, full historical data, and required access controls in one proof of concept.
Use the results for vendor selection: This gives leadership a stronger basis for choosing multi-location restaurant analytics software than any standard vendor demo.
Creating Trusted Analytics for Multi-Location Restaurant Chains
Patoliya Infotech helps restaurant chains build centralized analytics foundations through custom software development services that connect fragmented POS, inventory, labor, delivery, and operational data.
Our approach combines web application development services, multi-location restaurant analytics software, governed data models, reporting layers, and secure integrations to create consistent, decision-ready insights.
We focus on making data comparable across locations while preserving the flexibility chains need as they add stores, systems, and brands.
Conclusion
The next step is confirming that your locations can produce comparable numbers and that faster visibility delivers enough value to justify the investment. If reporting still runs on spreadsheets, mismatched POS systems, and competing KPI definitions, the real problem sits below the dashboard layer.
Build the data foundation first, test it against your hardest location, and choose multi-location restaurant analytics software only when it proves the numbers are accurate, traceable, and portable. For chains evaluating a restaurant chain data warehouse, start by identifying where your data stands today and what decisions better visibility should improve.
FAQs:
Single unit reporting only needs to be accurate for one kitchen. Multi-location restaurant analytics software has to standardize definitions, timing, and access across every location so leadership can compare units fairly rather than reading conflicting numbers from each site.
Timelines depend on the number of POS systems, data quality, and how many locations came from acquisitions. A chain with one clean POS moves faster than one with five legacy systems, so the realistic range spans several weeks to several months.
No. AI chat tools query whatever data sits underneath them. Without a governed restaurant chain data warehouse and clear metric definitions, the AI answers confidently using inconsistent numbers, which creates risk rather than removing it.
Most failures trace back to skipping the messiest location during testing. Vendors demo clean data from the flagship store, then the real acquired location with a legacy POS breaks the entire pipeline once implementation starts.
Usually not yet. Multi-location restaurant analytics software pays off once metric disputes, manual reporting hours, and growth through acquisition start costing real money. A five-unit chain with one POS system rarely needs that infrastructure today.