Predictive Analytics for Lab Turnaround Time & Capacity Planning
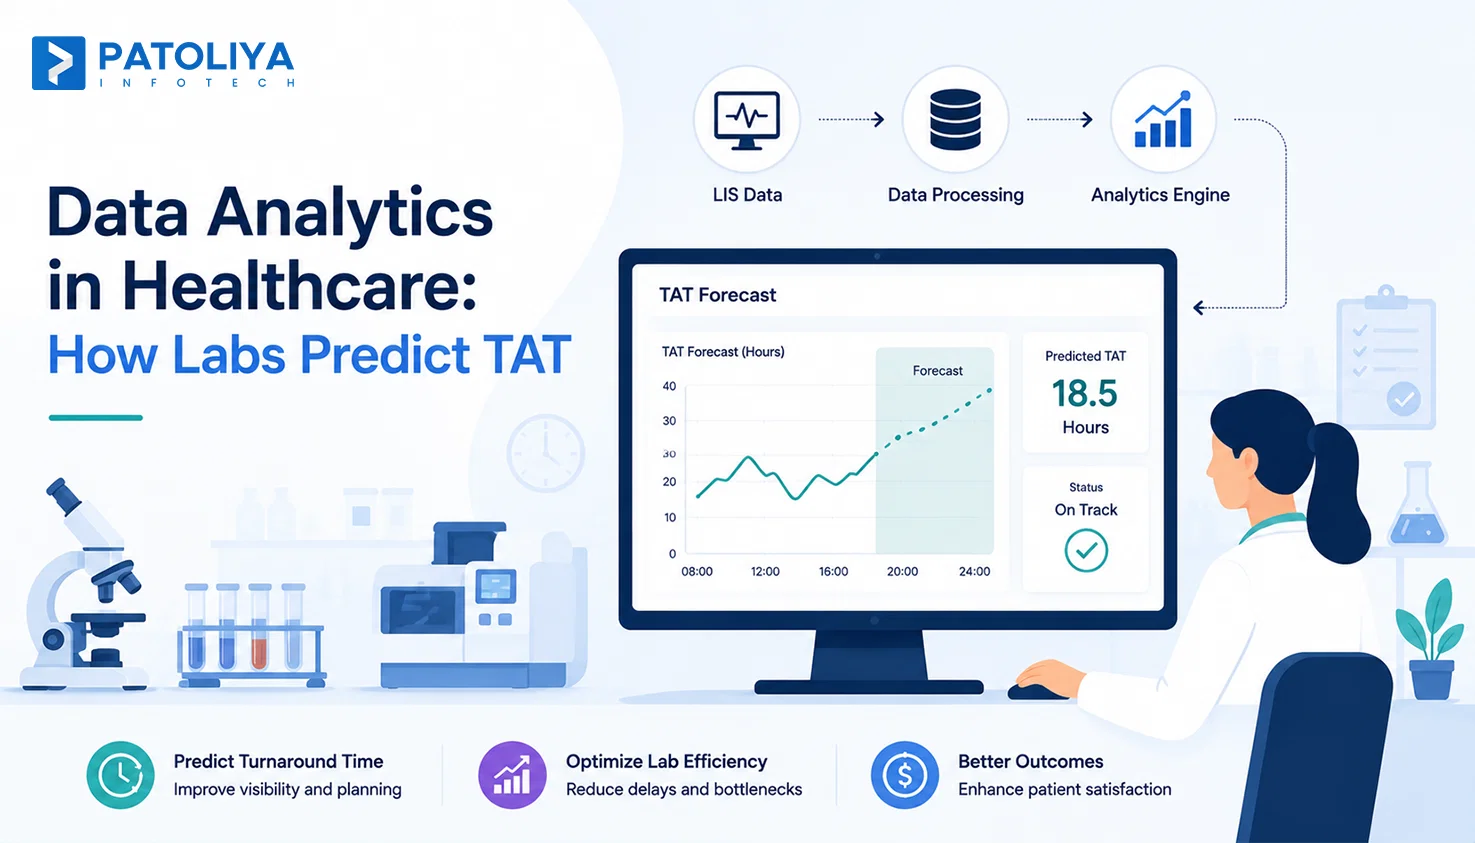
TL;DR: Most labs already own the numbers that predict a delay. They just read them after the delay happens. Data analytics in healthcare turns LIS, instrument, and staffing records into a forecast for turnaround time and capacity, so a supervisor sees a breach coming hours before a physician calls asking where the result is.
Your TAT dashboard tells you what already went wrong. It cannot tell you which queue breaks in the next ninety minutes. That gap is exactly where data analytics in healthcare stops being a reporting layer and starts becoming an operating layer for staffing, equipment, and diagnostic flow.
Labs that treat their historical numbers as a forecasting engine catch a bottleneck while it is still small enough to fix. This guide breaks down how predictive models actually work inside a lab, what data they need, and what a team should demand from a vendor before buying one.
How Data Analytics in Healthcare Becomes Operational Intelligence in the Lab
From Healthcare Data to Laboratory Operations
Every lab already runs on scattered sources, making healthcare data integration essential for connecting LIS and LIMS records, EHR orders, instrument logs, staffing rosters, and workflow data.
Healthcare data analytics earns its value only when LIS, LIMS, EHR, instrument, and staffing data sit in one operational view a supervisor can read in seconds during a shift change.
From Reporting to Prediction
Reporting shows a number. Monitoring shows a trend. Diagnosis explains why it moved. Predictive analytics in healthcare tells you where an operational problem is likely to go next, while intervention is the action a supervisor takes because of that forecast.
Most labs stop at monitoring, which is why data analytics in healthcare so often gets reduced to a dashboard nobody checks until something has already broken.
Why TAT Is a High Value Use Case
TAT sits at the center of diagnostic throughput, staffing, equipment use, and patient flow, which makes it the cleanest entry point for lab operations analytics in most facilities.
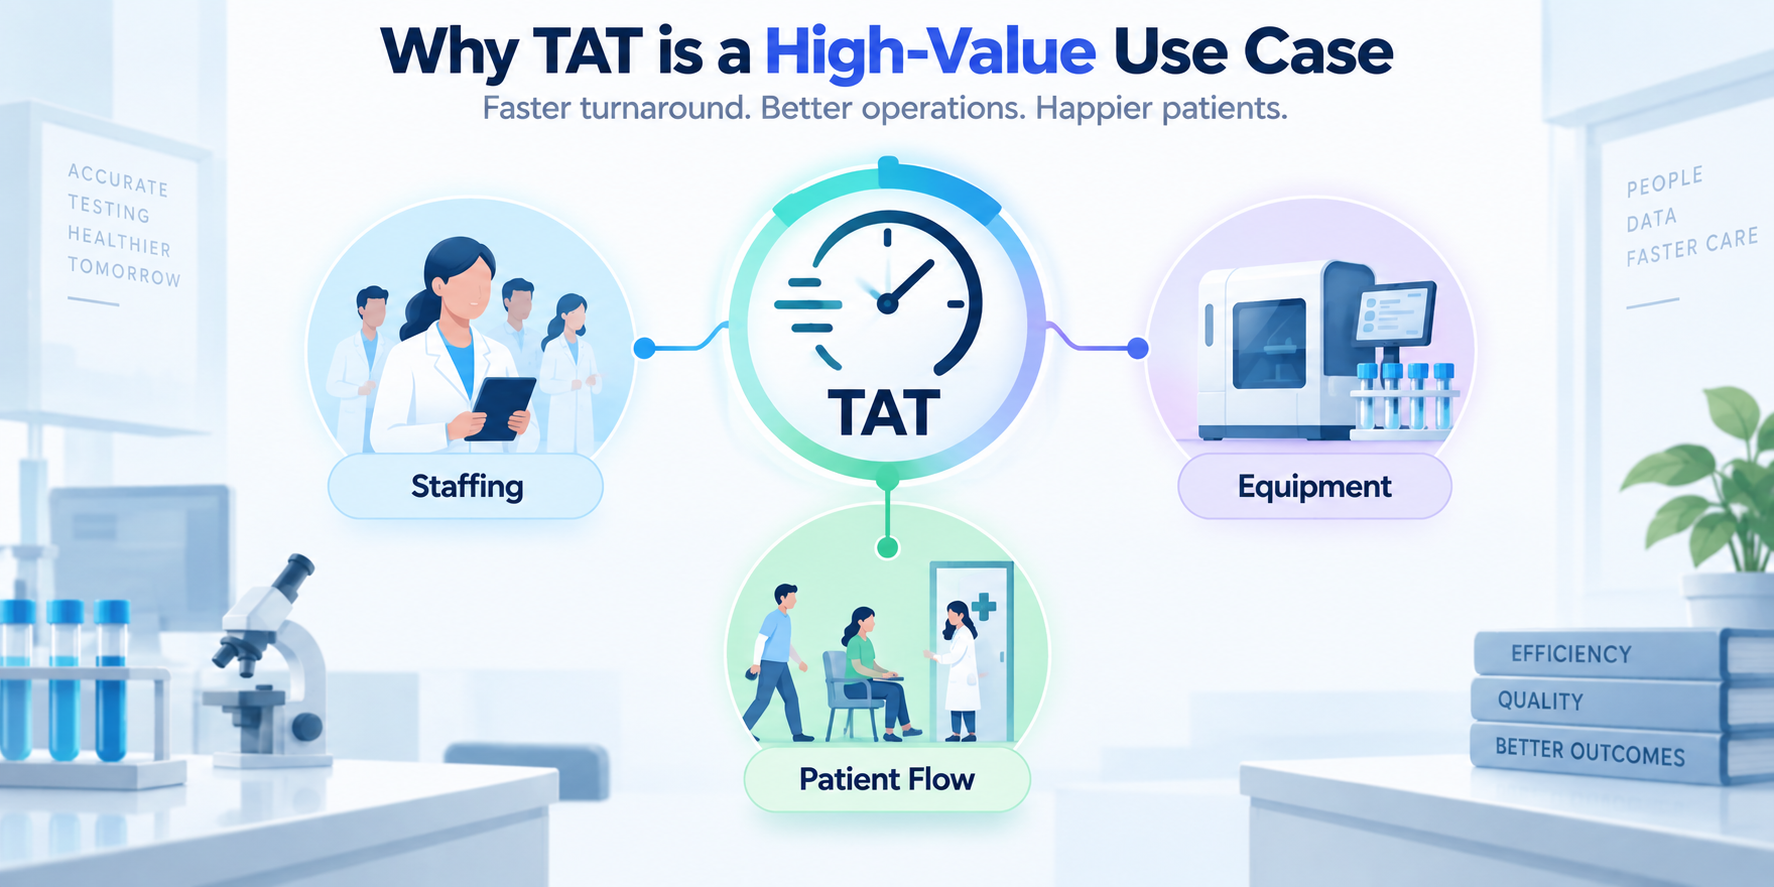
A single missed TAT target ripples into a delayed clinical decision and a frustrated care team. This is the reason TAT specifically deserves the first model a lab builds.
The TAT Baseline: Measure the Right Number Before You Predict It
What TAT Actually Measures
TAT has three phases inside data analytics in healthcare workflows. Pre-analytical covers collection to receipt, analytical covers receipt to result, and post-analytical covers result to release.
A prediction model built on unreliable timestamps in any of these three phases produces a confident, wrong answer.
Mean TAT vs P90/P95
An average TAT hides the worst cases completely. A lab reporting a mean TAT of 45 minutes can still be missing its STAT target on one in ten samples, and that ten percent is where clinical risk lives.
|
Metric |
What it shows |
Why it matters |
|
Mean TAT |
Typical result speed |
Hides outliers |
|
P90 TAT |
90th percentile speed |
Flags near misses |
|
P95 TAT |
95th percentile speed |
Flags SLA risk |
Tail end performance, not the average, is the real operational risk signal in lab turnaround time analytics.
STAT and Routine Need Separate Views
A blended view of STAT and routine samples flattens both into a meaningless middle number.
Segment by test, priority, department, shift, and location, because a routine chemistry panel and a STAT troponin do not share a target or a staffing pattern.
The Timestamp Problem: Why Predictive Analytics Fails Before the Model Is Built
Auto Captured vs Manually Entered Timestamps
Manual timestamps are the single biggest reason predictive models fail in production. Backfilled entries, inconsistent event definitions, and delayed manual logging quietly poison the training data.
|
Timestamp source |
Common problem |
Effect on prediction |
|
Automatic instrument capture |
Rare gaps |
Reliable input |
|
Manual entry |
Backfilling, delay |
Skewed predictions |
|
Middleware sync |
Missing events |
Broken sequence |
What Data Ready Actually Means
- Trusted lab data across LIS/LIMS timestamps, instrument feeds, test fields, staffing, and sample routing should feed a healthcare data warehouse or comparable governed analytics foundation.
- Consistent historical data covering volume, priorities, exceptions, and reruns on the same clock.
- Reliable timestamps matter because data analytics in healthcare cannot compensate for broken or inconsistent timing.
Can Your Data Explain Why TAT Changed
- Traceable data chain from volume and queue to resources, processing, and final results.
- More healthcare records do not automatically mean usable operational data, especially when the chain has gaps.
- Data analytics in healthcare works only when the full operational chain is visible and reliable end to end.
How Predictive Analytics Actually Works in Lab Operations
Predict Which Queues Are Likely to Breach TAT
In lab turnaround time analytics, current queue depth combines with incoming volume to set the baseline load.
Test complexity and priority mix change how fast that queue actually clears.
Staffing levels and analyzer availability decide whether the queue clears on time or backs up.
Historical patterns from the same shift, same day of week, fill in what a raw snapshot cannot show.
Detect Equipment and Workflow Anomalies Earlier
Inside data analytics in healthcare workflows, cycle time changes on an analyzer often show up hours before an outright failure.
Queue growth that does not match incoming volume points to a hidden bottleneck.
Reruns climbing above baseline usually mean a reagent or calibration issue starting to form.
Downtime patterns repeating on the same machine flag a maintenance need before it becomes an outage.
Give Forecasts With Confidence
A single number like an 87 minute prediction sounds precise and misleads a supervisor into false certainty.
A range like 70 to 140 minutes at 85 percent confidence gives an operations team something they can plan staffing around.
This is the standard any serious lab turnaround time analytics tool should be held to.
This step is where data analytics in healthcare moves from theory into a shift level decision.
Connecting TAT, Capacity, and Throughput Into One Operational View
TAT Alone Cannot Explain Laboratory Performance
Diagnostic throughput and TAT deteriorate together for reasons a TAT number alone never reveals, which is exactly why data analytics in healthcare has to look past TAT on its own. Volume spikes, staffing gaps, equipment limits, workflow steps and test complexity can each push TAT up, and often two or three move together.
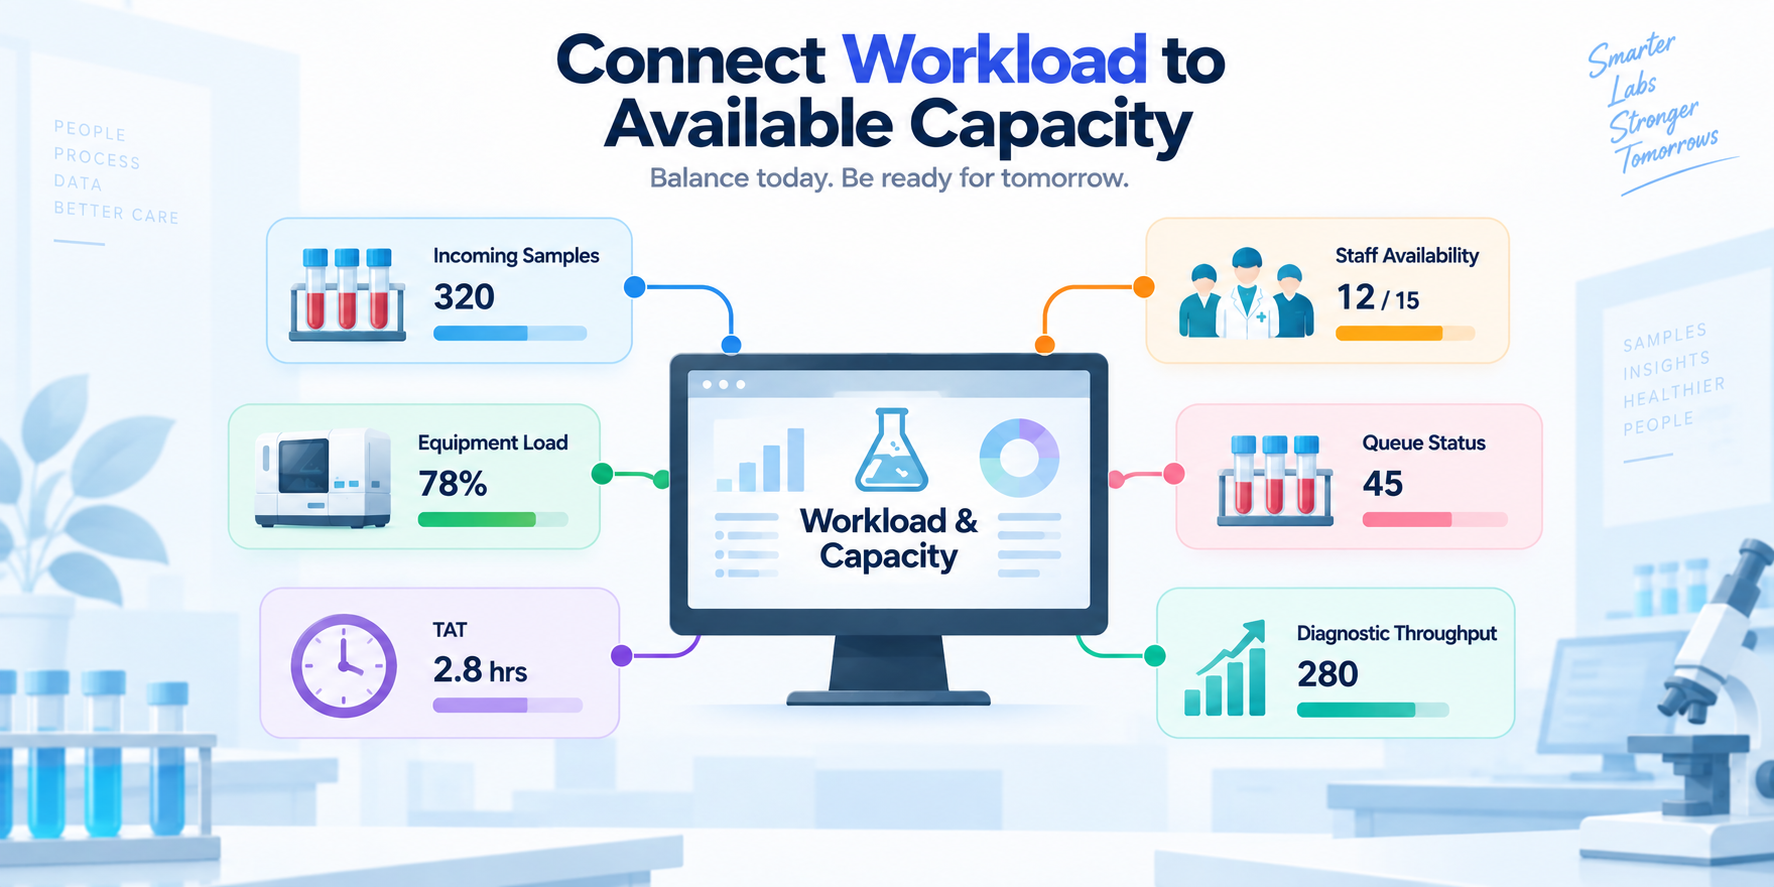
Connect Workload to Available Capacity
The chain runs from incoming volume to staff and equipment capacity to queue to TAT to diagnostic throughput. A model that only watches TAT is watching the last domino fall, not the one tipping it over first.
Identify the Constraint That Limits Throughput
Determine which link in the chain is actually the constraint.
- Staff availability on a given shift.
- Analyze capacity and cycle time.
- A specific workflow stage causing delay.
- Sample volume exceeding normal range.
- Test complexity mix shifting unexpectedly.
- Reporting or release step slowing final turnaround.
Data analytics in healthcare earns its keep here because it points to the actual constraint, not the symptom.
Data Analytics for Lab Capacity Planning: From Historical Volume to Future Constraints
Demand Curves Rarely Match Fixed Shift Schedules
A typical hospital lab sees a morning surge from inpatient draws that a flat eight-hour shift schedule was never built to absorb. Comparing that demand curve against actual staffing availability, hour by hour, is the starting point of real lab capacity planning.
A mid-size hospital lab that mapped this curve found its 6 am to 9 am window carried forty percent of daily STAT volume against the same fixed overnight staffing every single day.
Staff Capacity Is More Than Headcount
Skills, availability, shift coverage, competency on specific analyzers, and overtime limits all shape true capacity.
Two techs on paper can represent very different actual throughput depending on what each one is certified to run. Lab capacity planning built on headcount alone misses this every time.
Equipment Is a Capacity Constraint Too
Analyzer saturation, cycle time, test mix, and scheduled maintenance windows cap what a lab can process regardless of staffing.
One network running lab capacity planning across three sites found a single aging chemistry analyzer was the true ceiling on evening throughput, not the staffing roster everyone assumed.
Predict When Current Capacity Stops Being Enough
The question worth answering is simple. At what volume does current staffing and equipment stop meeting the TAT target, and how many weeks away is that point?
A lab in a growing health system that tracked this question found its evening shift would breach target within two quarters. This is what data analytics in healthcare adds that a static annual budget review never catches.
From Predictive Insight to Operational Action
Rebalance Work Before a Queue Becomes a Backlog: Healthcare workflow automation can help teams reassign staff, redirect samples to sites with open capacity, balance analyzer loads, and prioritize urgent tests when lab turnaround time analytics flags risk.
Put Predictions Where the Decision Happens: A forecast buried in a separate analytics tool never gets used during a shift.
It needs to live inside the LIS workflow, the operations screen, or the supervisor dashboard the team already checks every fifteen minutes.
Every Prediction Should Answer Five Questions: What is at risk, when will it happen, where in the workflow, why is it happening, and what action fixes it.
A prediction missing any one of these five becomes noise, not a decision aid, even when AI workflow automation for healthcare is used to turn predictions into operational actions. This is the point where data analytics in healthcare either earns a place in daily operations or gets ignored by week two.
The Alert Fatigue Problem in Predictive Lab Analytics
Why Too Many Alerts Become Noise
Low confidence predictions, duplicate alerts, and alerts with no clear action attached train staff to ignore data analytics in healthcare within a few weeks.
Rank Alerts by Risk and Operational Impact
Separate an immediate TAT breach from an emerging capacity risk and from a monitor only anomaly that does not need action yet.
A supervisor should see three alerts a shift that matter, not thirty that mostly do not.
What the Business Case for Predictive Lab Analytics Should Measure
Measure the Downstream Cost of TAT Delays
- Track downstream impact such as ED boarding time, length of stay, delayed clinical decisions, redraws, retests, and overtime.
- Quantify the financial impact of TAT delays rather than focusing only on the TAT number.
- Connect TAT to business outcomes such as reduced boarding hours and lower overtime spend.
- Use measurable outcomes to strengthen the case for investment in lab turnaround time analytics.
Measure Capacity Value
- Measure additional volume absorbed without adding headcount or increasing overtime.
- Track deferred expansion such as delayed equipment purchases or facility expansion.
- Measure workload balance across sites, shifts, instruments, and teams.
- Include capacity gains alongside direct labor savings when evaluating lab capacity planning.
Build the Case Around Your Baseline
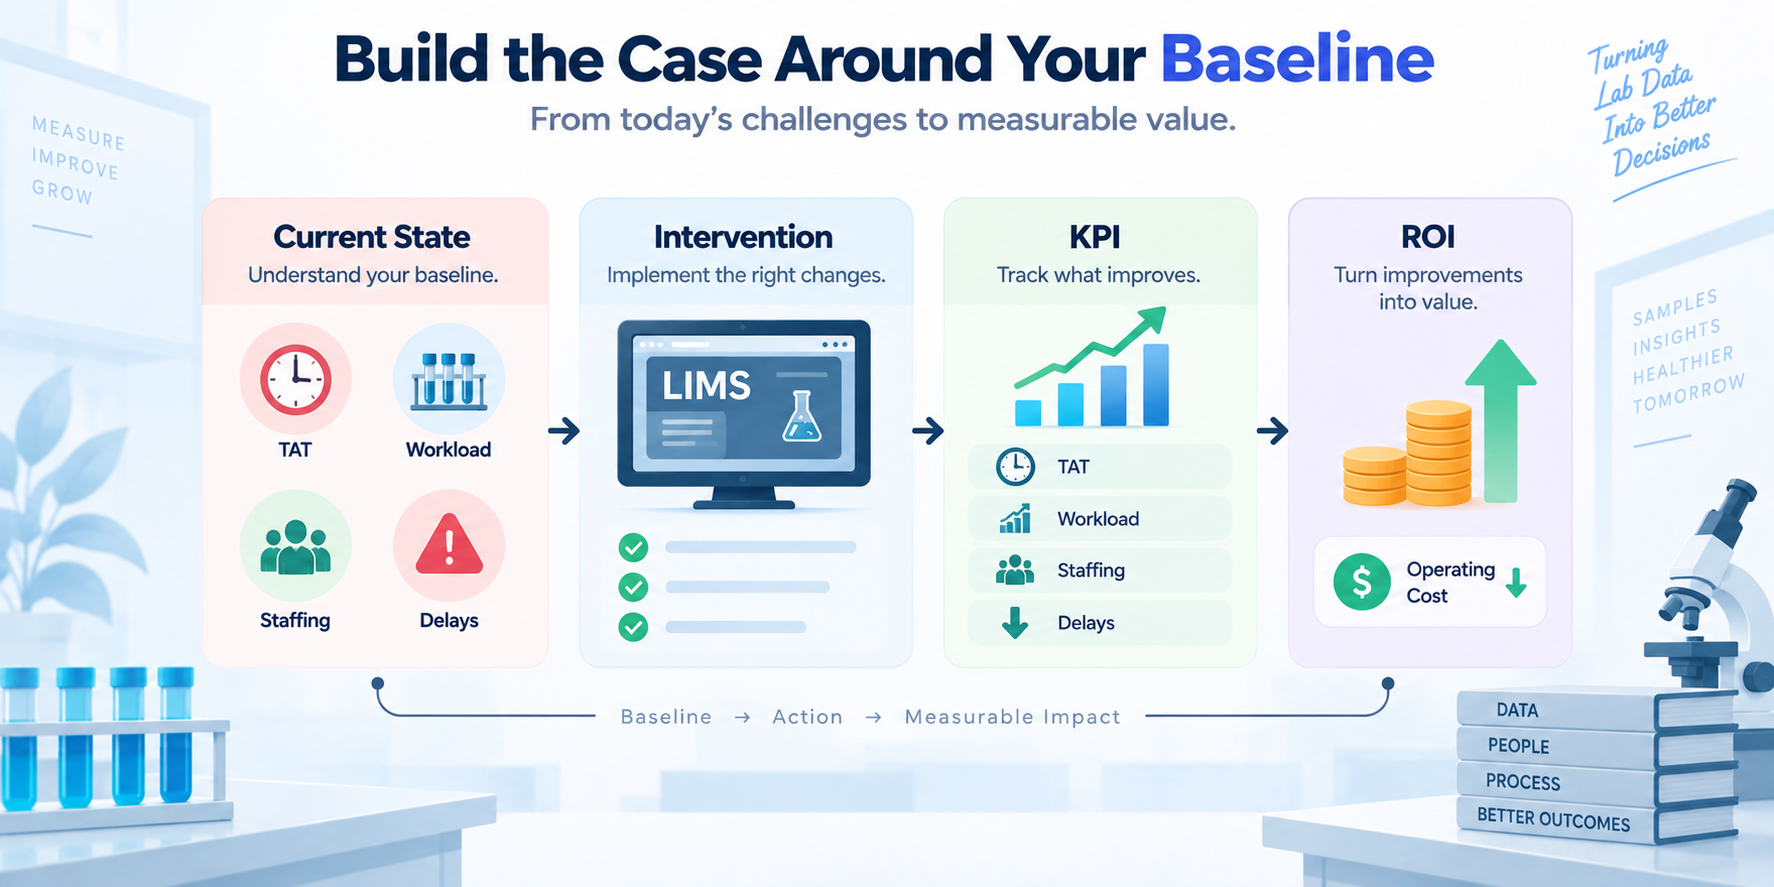
- Document the baseline including current TAT, workload, staffing, delays, and operating costs.
- Define the intervention and specify what operational change it is expected to create.
- Measure the resulting change using clear operational and financial KPIs.
- Connect the outcome to ROI so data analytics in healthcare demonstrates measurable business value.
What Should Healthcare Leaders Look for in a Predictive Lab Analytics Solution
Can It Connect to Your Healthcare Data Ecosystem
- LIS and LIMS systems across every site, using appropriate laboratory data standards to support consistent exchange from ordering through result delivery.
- EHR and EMR order data, including data made available through SMART FHIR integrations where appropriate.
- Instrument and middleware feeds.
- Workforce and scheduling systems.
- Multi-site data in one unified view, supported by API-first healthcare integration where systems need reliable data exchange across locations.
Can It Predict Rather Than Simply Report
Look for TAT forecasting, demand forecasting, capacity forecasting, risk prediction, and anomaly detection built in, with AI consulting services helping define the right models, architecture, and evaluation approach where needed. This is the layer where real healthcare data analytics separates itself from a repackaged reporting dashboard.
Can Operations Teams Act on the Insight
In data analytics in healthcare, the chain should run from data to prediction to explanation to action to measurement, visible to the team using it, not hidden inside a model only a data scientist can interpret.
What Happens When the Model Is Wrong
Ask directly about confidence scoring, explainability, a human override path, audit trails, and ongoing model monitoring. Any serious data analytics in healthcare vendor should walk you through a wrong prediction, not just a right one.
Is Your Laboratory Ready for Predictive Data Analytics
You Have the Data but Still React to Problems
Owning years of LIS records while still finding out about a delay from a physician call is a clear sign data analytics in healthcare has stalled at reporting.
Your TAT Problems Are Predictable but Not Yet Predicted
Recurring afternoon peaks and staffing gaps that show up every third shift are the exact patterns lab turnaround time analytics is built to catch before they repeat.
Your Capacity Decisions Depend on Averages or Gut Feel
Planning staffing off a yearly average volume number, when actual demand swings daily, is exactly where lab capacity planning built on real data starts paying for itself.
Your Data Foundation May Need Work First
Poor timestamps or disconnected systems across sites need fixing before a predictive layer can sit on top of them with any real accuracy. No amount of data analytics in healthcare investment fixes a broken timestamp field.
How to Measure Whether Predictive Lab Analytics Is Working
TAT and Diagnostic Throughput: Inside data analytics in healthcare, P90 and P95 TAT, SLA compliance rate, STAT TAT, and queue time are the core lab turnaround time analytics numbers to watch weekly alongside overall diagnostic throughput.
Capacity Outcomes: Tests processed per hour, analyzer utilization, staff utilization, overtime hours, and backlog size show whether lab capacity planning decisions are actually holding.
Prediction Quality: Forecast accuracy against actual outcomes, false positive alert rate, false negative alert rate, and model drift over time tell you whether the model still deserves trust, which is critical when evaluating AI product engineering services for production analytics systems.
Business Outcomes: Cost per test, overtime avoided, capital investment deferred, and added diagnostic throughput close the loop back to the original business case for data analytics in healthcare.
Why Enterprises Trust Patoliya Infotech
Enterprises trust Patoliya Infotech because we understand the operational realities behind clinical and diagnostic workflows.
- Healthcare expertise: Deep experience across labs, healthcare operations, and data-driven workflows.
- Real-world outcomes: Supported laboratory modernization, including workflows handling 1,000+ daily work orders and long-term technology partnerships.
- Operational intelligence: Built solutions around LIS/LIMS, EHR data, instruments, staffing, TAT, capacity, and diagnostic throughput.
- Enterprise thinking: We connect technology decisions to measurable outcomes like efficiency, throughput, capacity, and ROI.
This is why Patoliya doesn’t simply build healthcare software.
We understand the systems, workflows, and business outcomes that make healthcare technology work.
Conclusion
Data analytics in healthcare provides the raw foundation every lab already sits on. Lab turnaround time analytics turns that foundation into operational visibility a supervisor can actually use. Predictive analytics identifies what is likely to happen next, and lab capacity planning shows whether current resources can absorb it.
The value was never another dashboard. It is knowing exactly where TAT or capacity is likely to fail before it actually does, with enough lead time to fix it quietly, not explain it loudly after the fact. Labs that treat data analytics in healthcare as an operating discipline, not a reporting exercise, are the ones that stop missing the same breach every quarter.
FAQs:
Data analytics in healthcare connects LIS, EHR, instrument, and staffing data into one operational view, turning scattered records into forecasts for turnaround time, staffing needs, and equipment load a supervisor can act on during a live shift.
It flags a queue likely to breach target hours in advance, giving supervisors time to rebalance staff or analyzers before a delay reaches the physician, not after the result is already late.
Reliable LIS and LIMS timestamps across all three TAT phases, instrument and middleware feeds, staffing and priority data, and historical volume patterns segmented by test type, shift, and location.
Yes. Lab capacity planning compares demand curves against actual staff and equipment availability, showing the exact point where diagnostic throughput stops meeting the TAT target so leaders can plan ahead of a backlog.
Full connection to LIS, EHR, and instrument systems, genuine forecasting, not just reporting, clear explainability when a prediction is wrong, and a human override path with audit trails built in from day one.
Lab results drive most downstream clinical decisions, so a delay in diagnostic throughput cascades into boarding time, discharge time, and treatment timing across the entire hospital, not just the lab itself.