AI Agent Observability: Tools, Metrics and Tracing
 By Hitesh SUpdated on: 10/08/2612 min read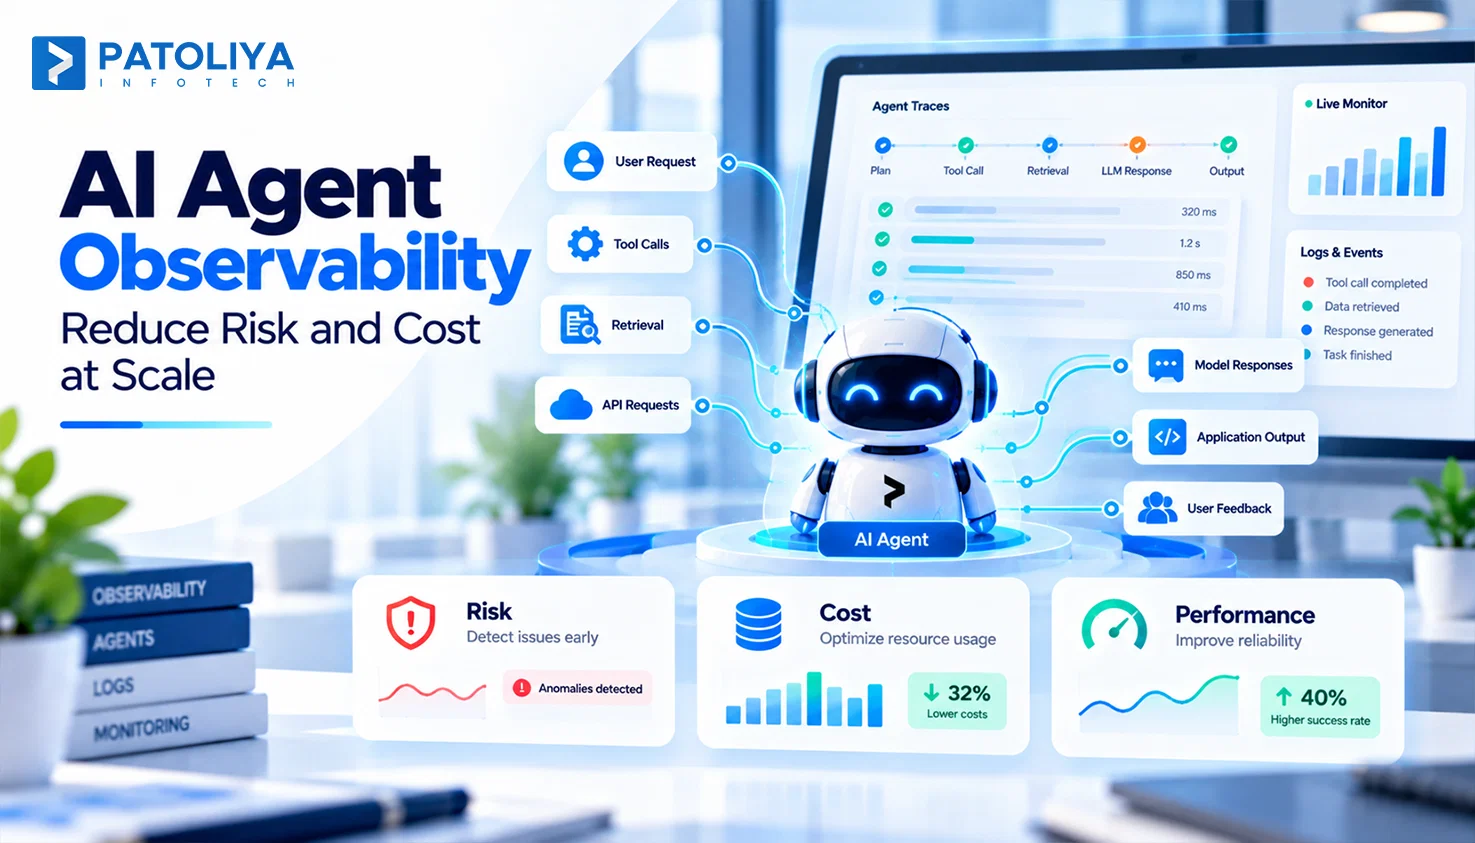
TLDR: AI agent observability records every step an agent takes, scores whether the result was good, and shows exactly where a run went wrong. LLM tracing gives you that step by step record. Teams that connect traces, evaluations, and cost data fix agent failures in hours.
Your APM dashboard says the agent responded in 4 seconds with a 200 status. The customer still got a wrong refund amount. Traditional logging tracks requests and errors, and agents fail in places those tools never look. One request can pass through an LLM call, a retrieval step, two tool calls, a retry, and a subagent before anyone sees an answer.
AI agent observability gives you three jobs in one system: trace what happened, evaluate whether it was good, and debug why it failed. LLM tracing is the foundation for all three. This guide will break down how to build each layer for production agents.
What AI Agent Observability Actually Needs to Capture
AI agent observability requires a different unit of work. Traditional applications are centered on requests, while agents operate through runs that involve multiple decisions, model calls, tools, retrieval steps, and sometimes subagents. Observability therefore needs to capture the full execution path rather than treating the final response as the only outcome.
A traditional application maps a request to an API call, service dependency, error status, response latency, and logs. An AI agent maps that same flow to an agent run, LLM generation, tool, retrieval, or subagent call, semantic failure, multi-step latency, and a trace containing span context.
Structure your data in five nested levels:
Session: one user conversation across many turns.
Trace: one complete agent run for one request.
Agent span: the planning and routing step.
LLM, retrieval, and tool spans: each operation the agent performed.
Evaluation: the quality score attached to the finished trace.
A useful trace reconstructs the full execution path. Storing only the final answer leaves you guessing. Strong AI agent observability lets an engineer replay the exact sequence of decisions, and LLM tracing supplies that sequence.
LLM Tracing: Build a Trace That Explains Every Agent Run
A trace covers one complete agent run. A span covers one operation inside it. Events and attributes hold the details, such as token counts or a tool error message. Together, traces and spans form a tree you read top to bottom, the core artifact of AI agent observability. Example: a customer asks for a refund.
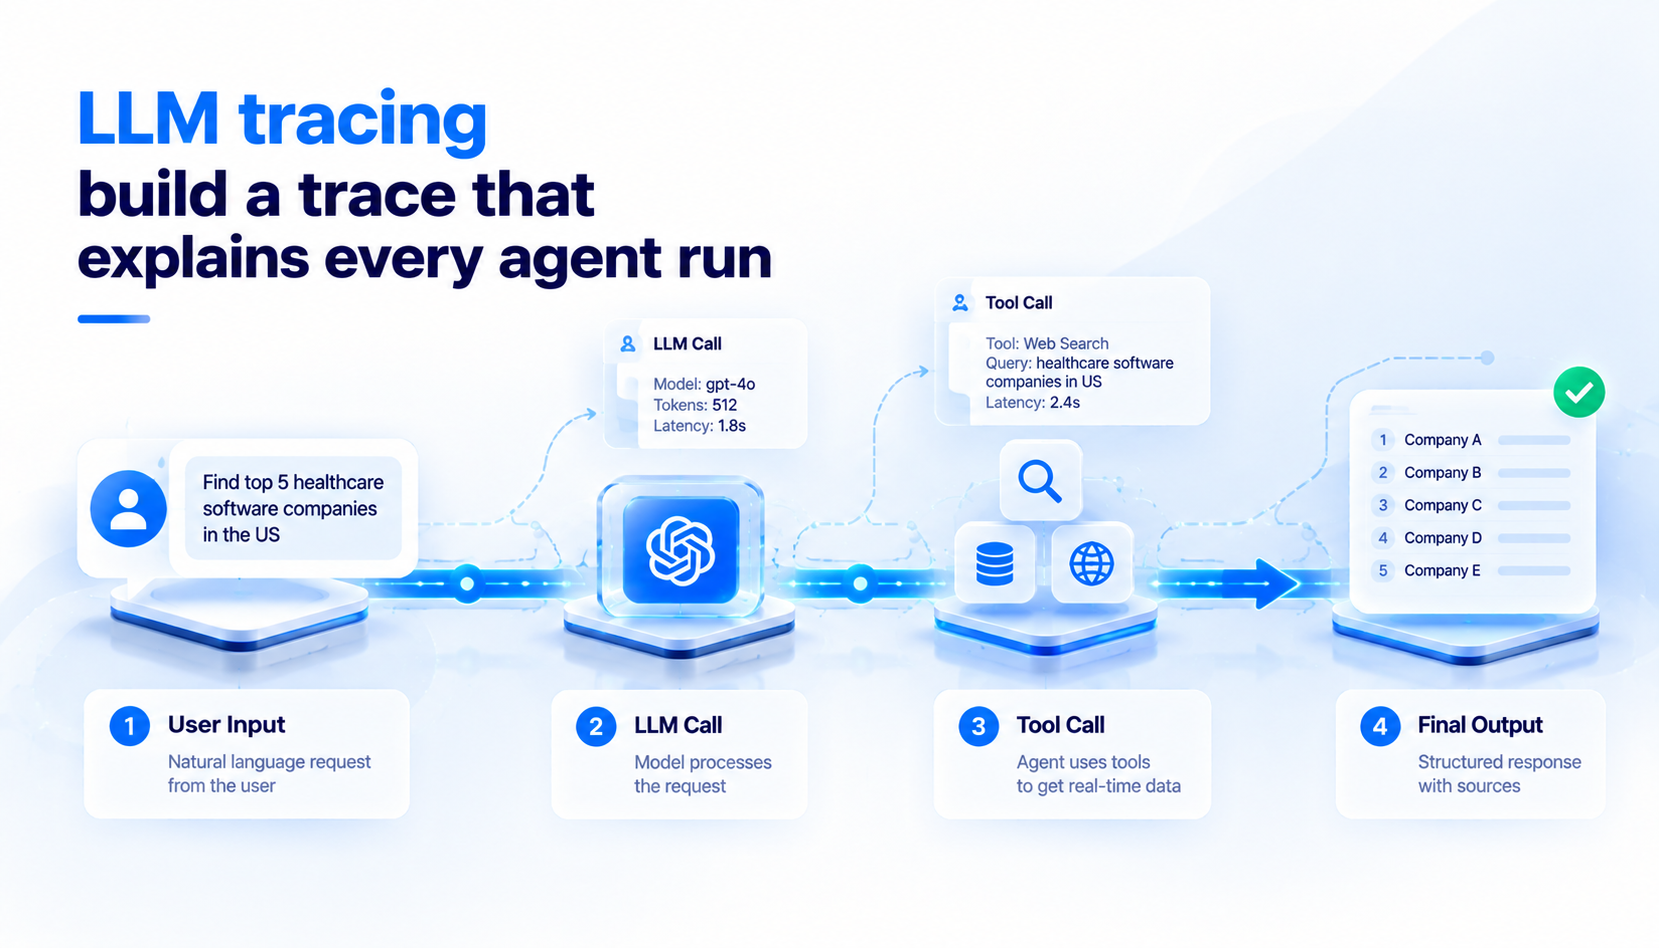
A refund trace captures each step: planning, policy retrieval, order lookup, refund calculation, and API execution. If the amount is wrong, the trace shows whether retrieval, data, or calculation caused the error.
Good LLM tracing captures enough detail to rerun the call:
- Model and provider details, enabling version comparisons after upgrades.
- Prompt and prompt version tracking, ensuring changes remain visible across deployments.
- Input and output tokens, which drive cost.
- Latency and finish reason, which reveal truncation and slow calls.
- Errors, retries, and tool calls, which expose loops.
- Trace and session IDs, which link the span to the full run.
The OpenTelemetry GenAI semantic conventions define shared gen_ai* attributes for model, provider, token usage, and agent and tool operations. Standard names mean every backend reads your spans the same way. Instrument your system once, then change vendors without having to rewrite the code. The full specification now lives in the OpenTelemetry GenAI semantic conventions repository.
A standard pipeline connects four components: your agent application emits spans, OpenTelemetry instrumentation adds gen_ai* attributes, a collector batches, filters, and routes the data, and your observability backend stores and visualizes it.
Treat this pipeline as the core of AI agent observability, and keep the vendor at the edge. Consistent AI agent observability across teams also makes the LLM observability work your platform team already runs easier to extend, and it survives every tool migration.
Key Production Metrics: Response Time, Cost, Failures, and Output Quality
Operational Signals: Every AI agent observability dashboard should plot latency p95 next to p50, because the slowest 5% of runs drive most complaints.
Track time to first token, total execution time, tool latency, retry count, error rate, and timeout rate. Example: p50 holds at 3 seconds while p95 jumps to 40 seconds. This pattern often indicates that a tool is timing out and triggering retries.
Economic Signals: Token usage monitoring shows input and output tokens per call. Roll those numbers up to cost per LLM call, cost per trace, and cost per successful task. Watch for expensive loops where the agent calls the same model or tool five times in one run.
Quality Signals: Quality covers hallucination rate, groundedness, answer relevance, tool selection accuracy, task completion, and escalation rate. Without quality metrics, AI agent observability confirms execution but cannot show whether the agent delivered useful results.
A fast agent can still be a bad agent. Production AI agent observability connects latency, cost, reliability, and quality on the same trace. LLM tracing makes that possible, because each signal attaches to the span that produced it.
When one dashboard shows a cheap, fast run with a low faithfulness score, you know where to look. Quality signals need a scoring system behind them.
Evaluating Agents in Production
Offline evaluation runs golden datasets and regression tests on controlled inputs before release. Production evaluation scores real user traces and catches distribution shift, where users ask things your test set never covered. You need both. Offline tests protect releases, and evals in production protect users.
Score each sampled trace for faithfulness and hallucination detection, tool call correctness, retrieval quality, response relevance, policy compliance, task completion, and escalation behavior.
Pick the three that matter most first, then widen your AI agent observability coverage. A support agent cares most about policy compliance. A research agent cares most about faithfulness.
Our guide to production AI evaluation covers how product teams set acceptance thresholds. For techniques specific to grounding, see our notes on hallucination detection.
Evaluation Architecture
A production evaluation loop collects finished traces, samples them, and sends them to an LLM judge or code-based evaluator. The resulting score is stored on the trace and compared against a threshold. Low-scoring traces can trigger alerts or be routed for human review.
Evaluators cost money and make mistakes. An LLM judge produces false positives and false negatives. Validate every evaluator against a set of human reviewed traces before you trust its alerts.
This step separates mature AI agent observability from noisy dashboards, and it keeps your AI agent observability budget focused on real failures. Scores matter most when they lead to a fix.
Debugging a Failed Agent Run: From Symptom to Root Cause
Step 1: Find the Anomalous Trace
Start from the symptom. Example: p95 latency for the refund workflow jumps from 8 to 35 seconds. Filter traces above 30 seconds in the last hour.
Step 2: Expand the Span Tree
Open one slow trace and read the span durations. The delay sits in one of six places: LLM generation, retrieval, an external API, tool execution, a retry loop, or a subagent handoff. LLM tracing shows the slow span in seconds.
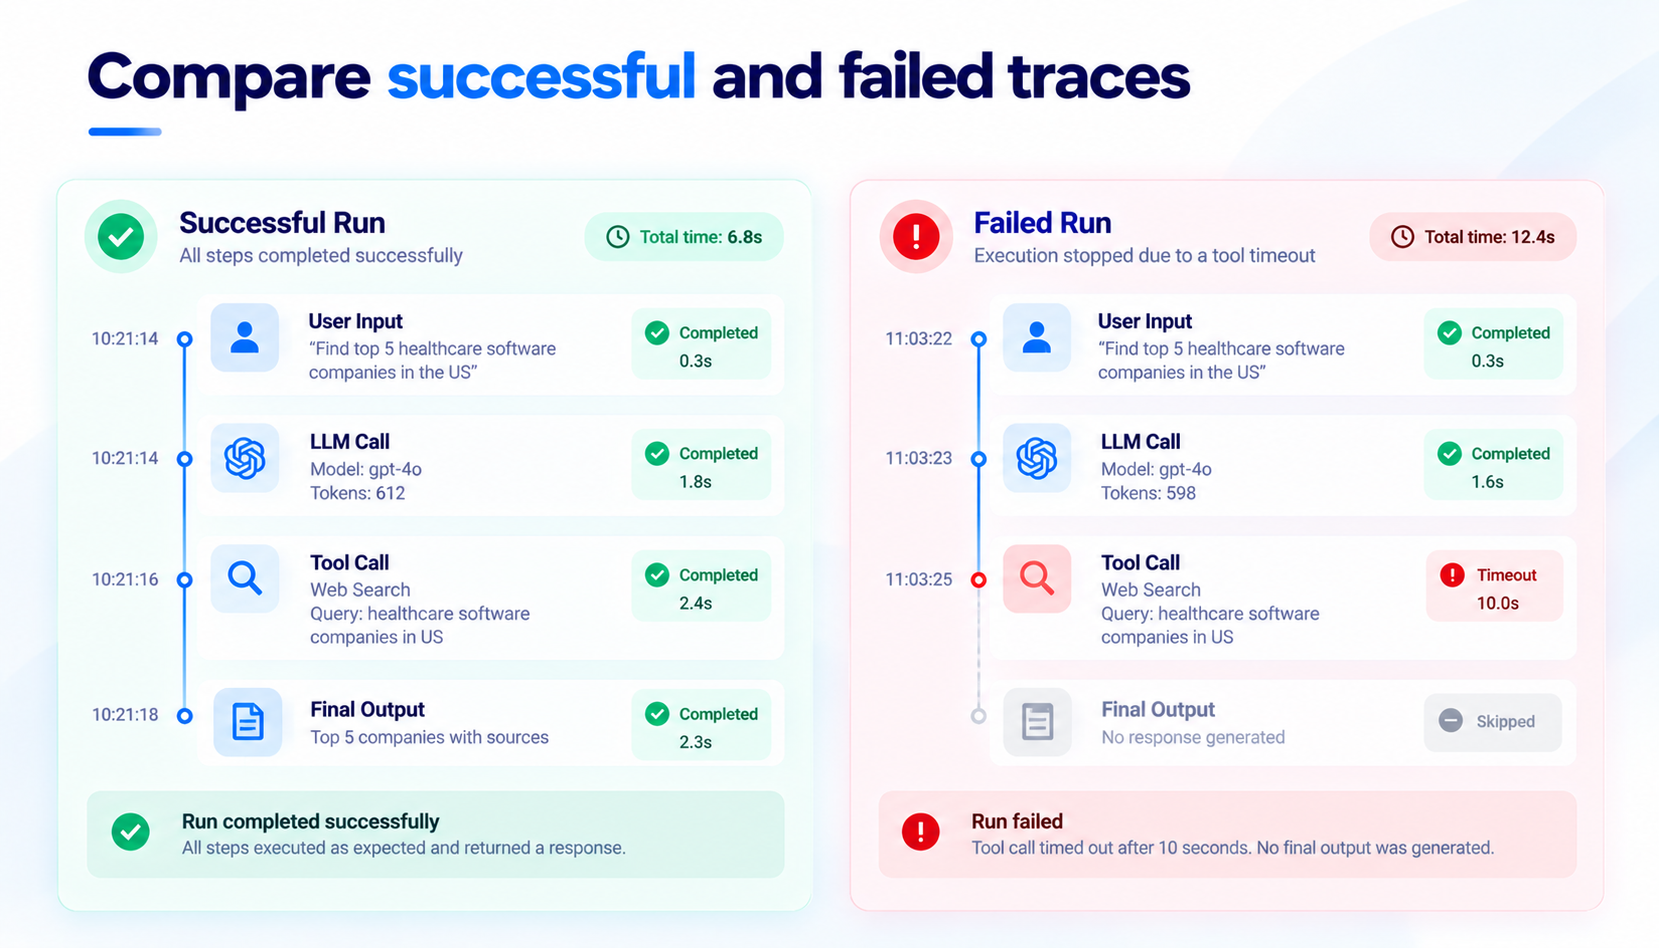
Step 3: Compare Successful and Failed Traces
Place a healthy trace next to the failed one. Compare the model, prompt version, retrieved documents, tool arguments, token count, latency, and evaluation score. The difference usually jumps out. In our example, failed traces pass an order ID with a trailing space, and the Order API retries three times before timing out.
Step 4: Identify the Failure Class
Classify the root cause as one of five types:
Model: wrong reasoning or format from the LLM.
Retrieval: missing or irrelevant context.
Tool: bad arguments or a failing external API.
Orchestration: wrong routing, loops, or broken handoffs.
Infrastructure: timeouts, rate limits, or network faults.
Step 5: Fix and Regression Test
Fix the cause, add the failed trace to your golden dataset, and rerun evaluations before release. Every production failure should become a permanent test. Our review of AI testing and evaluation tools covers regression options.
This loop turns AI agent observability into a working debugging practice. Skip step 5 and the same failure returns within weeks. A disciplined AI agent observability process makes each incident cheaper than the last, and your AI agent observability data compounds into better releases.
Observability for Multi-Agent Systems
A planner agent can delegate a user request to specialist agents, each with its own tools. The Research agent uses a search tool, the Data agent uses a SQL tool, and the Writer agent uses an LLM to produce the final output.
Without trace context, this one request splits into four unrelated traces. Each agent span must carry the parent trace ID across service calls, queues, and background jobs. The OpenTelemetry guide to context propagation explains how to pass that context across process boundaries.
Track parent and child links, handoffs, shared state, asynchronous steps, and subagent failures. Session views matter because one run often spans several user turns. Our breakdown of AI agent orchestration covers how planners route work.
Score the whole chain, from the final answer back to the first handoff. Evaluate each agent's output, each handoff, each tool action, and the complete workflow. A perfect final answer built on a wrong SQL query is a lucky accident. AI agent observability for multi-agent systems depends on LLM tracing that keeps every hop connected, and it gives AI agent observability owners one view of the full chain.
Cost and Sampling: Make Observability Economically Sustainable
Cost tracking belongs inside your traces. Record tokens per request, cost per trace, cost per user session, cost per model, cost per tool loop, and the cost of running evaluations themselves.
Sampling Strategy
Storing every span indefinitely can become expensive quickly, so apply three retention rules: keep a sample, such as 10%, of normal traces; retain every error, high-latency, and high-cost trace; and keep a higher share of critical workflows, such as payments.
Protect Data Before It Leaves
Scrub PII, secrets, and tokens in the collector before telemetry reaches any external backend. Redaction belongs at the edge of your system.
Sustainable AI agent observability balances detail with spend. Tools such as Langfuse accept OpenTelemetry data and add token and cost views on top, so standard AI agent observability telemetry feeds vendor features without new instrumentation. With the data model set, the next decision is the stack.
Choosing an AI Agent Observability Stack
Your AI agent observability stack has two parts: an instrumentation layer and a backend.
|
Platform |
Strong fit |
Consideration |
|
Langfuse |
Open source, self-hosted tracing, cost, and evals. |
Your team owns operations. |
|
LangSmith |
LangChain and LangGraph workflows. |
Best inside that ecosystem. |
|
Arize Phoenix |
OpenTelemetry and OpenInference with deep evaluation. |
Evaluation setup takes planning. |
|
OpenTelemetry |
Vendor neutral instrumentation. |
Needs a backend to store data. |
Score each candidate against your framework, OpenTelemetry support, self hosting and data residency needs, evaluation features, trace search speed, cost visibility, PII controls, alerting, and enterprise integrations.
Pick the backend that matches your framework and compliance needs today, and keep instrumentation standard so you can switch later. Strong LLM tracing should never lock you into one vendor. Teams adding tool servers should also plan MCP tool monitoring and RAG observability inside the same backend, so AI agent observability covers every component.
The Production Architecture: Instrument Once, Observe Everywhere
The Reference Flow
A production observability setup has six layers: the AI agent application runs the workflow; OpenTelemetry or OpenInference emits spans; the OpenTelemetry Collector filters, samples, and routes telemetry; tracing and metrics stores feed the observability backend; evaluations, alerts, and human review act on the data; and engineering, product, and operations teams use the findings to improve the system.
Architectural Decisions That Matter
Separate instrumentation from the backend. Standardize your telemetry schema across teams. Propagate trace context through every service.
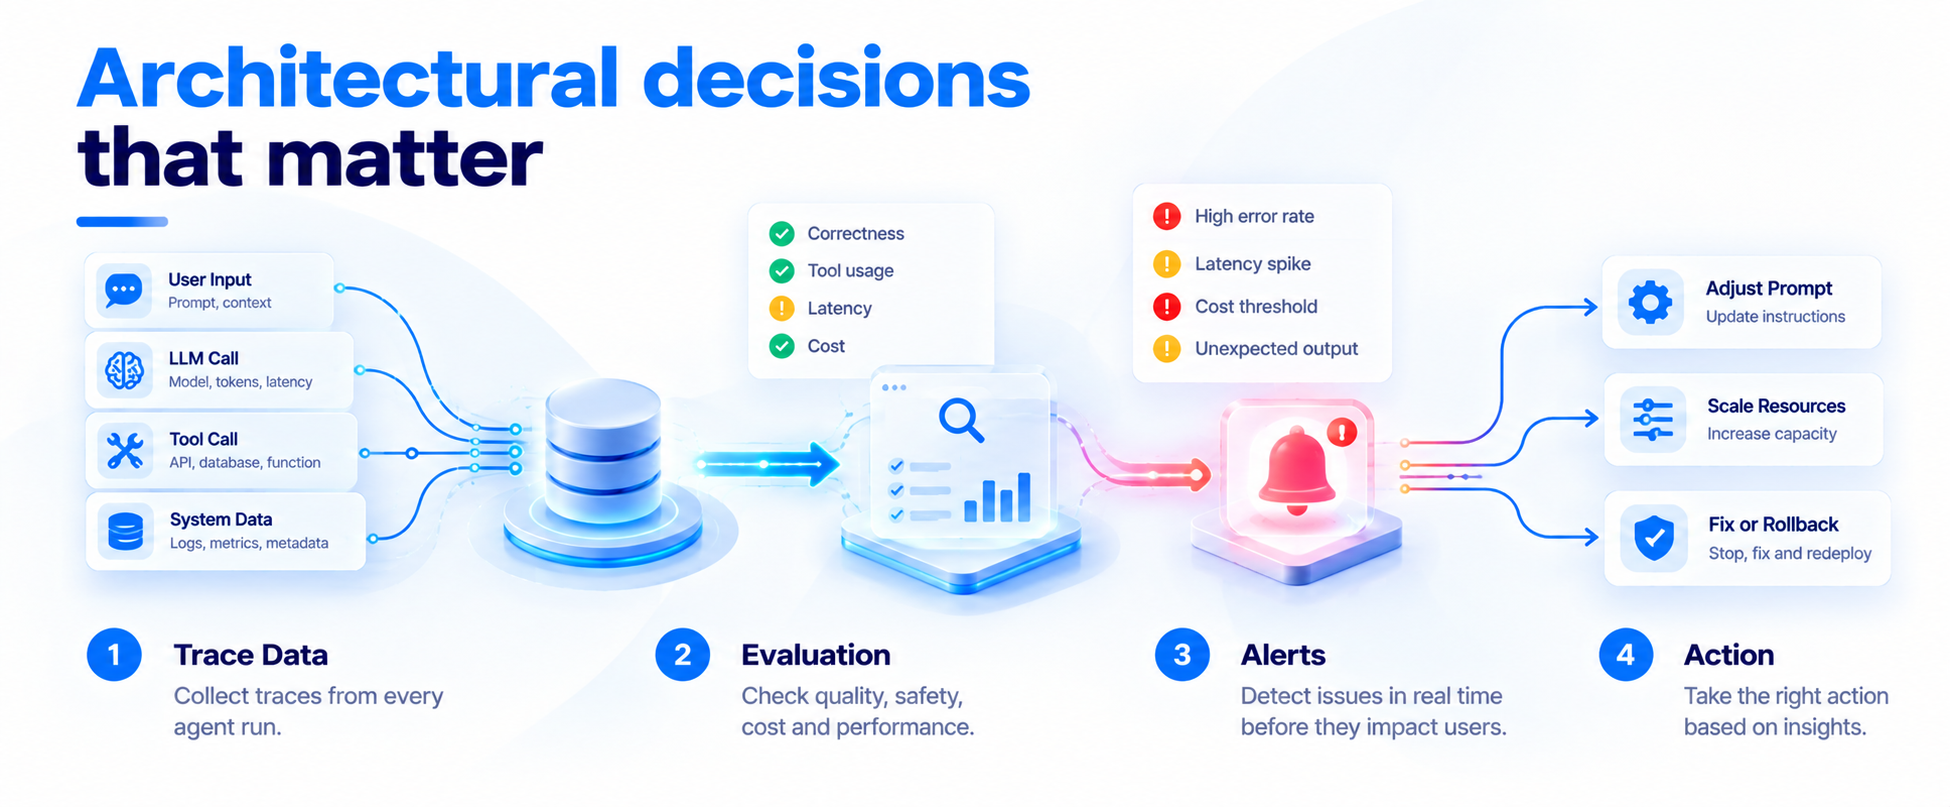
Scrub sensitive data in the collector. Control sampling centrally and retain every critical trace. Connect evaluations directly to production traces, using the same patterns as distributed tracing in cloud native systems.
AI agent observability is an architectural capability, and it belongs in the design before launch.
Leaders who fund AI agent observability in the first sprint ship agents their teams can actually support.
Production AI Agent Observability Checklist
Production AI agent observability should ensure every agent run has a trace ID, with model, token, latency, tool calls, results, and retrieved context captured across spans.
Monitor p95 latency, cost per run and session, production quality evaluations, groundedness, faithfulness, and quality drift.
Failed traces should be searchable by attributes, while PII and secrets are filtered in the collector.
Maintain human review paths, preserve trace context across multi-agent handoffs, and retain every critical failure for reliable debugging, governance, and continuous improvement.
Teams that pass all fourteen checks run AI agent observability as an engineering system.
Build Production-Ready Agent Observability With Patoliya Infotech
Patoliya Infotech builds AI agent observability into agents from the first sprint, so every run is traceable, scored, and debuggable. Our AI product engineering services cover:
Instrumentation uses gen_ai.* spans across agents, tools, and retrieval, while production evaluators are validated against human-reviewed traces. Cost is controlled through sampling, redaction, and cost-per-task dashboards.
Need a roadmap first? Our artificial intelligence consulting services start with a 30-minute observability review of one agent workflow.
Conclusion
AI agents can fail across reasoning, tools, retrieval, and workflows without leaving an obvious signal. AI agent observability connects traces, evaluations, costs, and operational metrics to make these failures measurable. By tracing production runs, evaluating real traffic, inspecting execution paths, and learning from recurring failures, engineering teams can improve reliability over time.
The goal is not simply to collect more telemetry, but to create a feedback loop between production behavior and engineering decisions. With the right observability foundation, teams can turn complex agents into systems they can measure, govern, and continuously improve.
FAQs:
AI agent observability typically combines distributed tracing, evaluation, logging, metrics, cost tracking, and monitoring to provide a complete view of agent behavior.
Multi-agent systems introduce more execution paths and dependencies. Observability helps teams understand interactions between agents and identify failures across the broader workflow.
A useful dashboard can combine reliability, latency, quality, token usage, cost, tool performance, and workflow-level metrics to support faster operational decisions.
Observability creates an audit trail of agent activity, making it easier to review behavior, enforce controls, investigate incidents, and demonstrate operational accountability.
Observability should be introduced before production scale so teams can establish baselines, detect regressions, and understand agent behavior as usage grows.